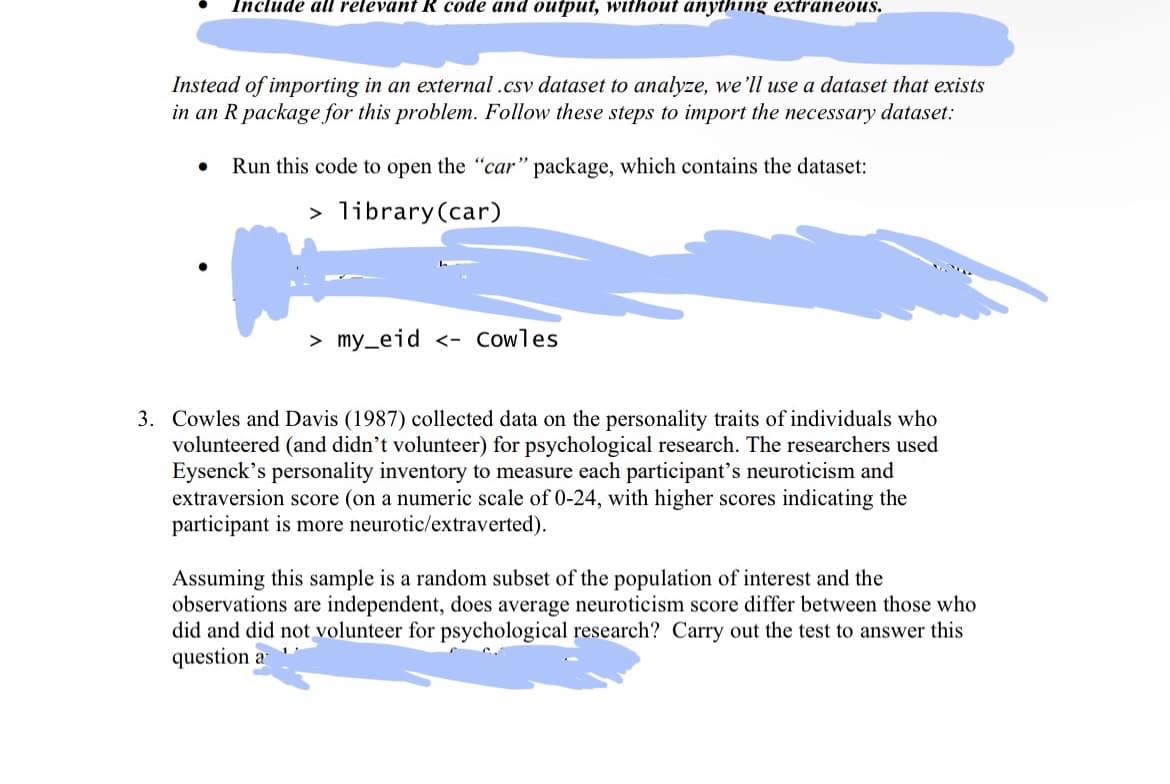
Instead of importing in an external .csv dataset to analyze, we'll use a dataset that exists in an R package for this problem. Follow these steps to import the necessary dataset: Run this code to open the "car" package, which contains the dataset: > library (car) > my_eid <- Cowles 3. Cowles and Davis (1987) collected data on the personality traits of individuals who volunteered (and didn't volunteer) for psychological research. The researchers used Eysenck's personality inventory to measure each participant's neuroticism and extraversion score (on a numeric scale of 0-24, with higher scores indicating the participant is more neurotic/extraverted). Assuming this sample is a random subset of the population of interest and the observations are independent, does average neuroticism score differ between those who did and did not volunteer for psychological research? Carry out the test to answer this question a
Q: sample 120 R 200 individuals who are currently employed is asked if they work at home at least once…
A: n=200x=37
Q: Thompson and Thompson is a steel bolts manufacturing company. Their current steel bolts have a mean…
A: Let X be the diameter of the steel bolt.Given, µ=125 millimetres and σ2=49.
Q: • the 90% Cl for mu [Select] • the 95% CI for mu [Select] • the 99% CI for mu [Select] V include 3…
A: Given that,Population mean P-value = 0.13Confidence levels:
Q: For each of the following residual plots against the predicted value, state which assumptions, if…
A: It is required to identify the assumptions of a normal error simple linear regression model that are…
Q: To study the output of a machine that fills boxes with cereal, a quality control engineer weighed…
A: x=weight(ounces)Number of boxes15.3≤X≤15.61115.6≤X≤15.92615.9≤X≤16.28816.2≤X≤16.51616.5≤X≤16.89
Q: Matthew, an experimental psychologist, indicates that the age at which a child learns to walk is…
A: Mean() = 10.9 Standard deviation () = 0.5X ~ N (µ, σ) = N( 10.9, 0.5)
Q: The ability of an interval estimates to contain the value of the population parameter is described…
A: The given question is:The ability of an interval estimates to contain the value of the population…
Q: Suppose the horses in a large stable have a mean weight of 992lbs992lbs, and a standard deviation…
A: Population mean=992Population standard deviation=141Sample size n=37
Q: K ces (a) A poll of 2,256 likely voters was conducted on the president's performance. Approximately…
A: Sample size(n) = 2256p = 0.50Confidence interval(c) = 0.96
Q: Make an analysis regarding this graph residual 5 4 3 2 -1 -2 Samply -3 -4 1950 1960 S Regression…
A: The given graph is a residual plot where y-axis denotes the residuals and x-axis denotes the…
Q: A particular fruit's weights are normally distributed, with a mean of 209 grams and a standard…
A: Population mean, μ = 209 gramsPopulation standard deviation, σ = 18 gramsLet, X, be the particular…
Q: 1. Fix r € N, and suppose that Y₁,..., Yn are independent and identically distributed NegBin(r, )…
A: Fix , and suppose that Y1,......................................, Yn are independent and identically…
Q: The lengths of pregnancies in a small rural village are normally distributed with a mean of 263 days…
A: Mean=263Standard deviation=14
Q: Let z be a standard normal random variable with mean = 0 and standard deviation o1. Use Table 3 in…
A: Let z be a standard normal random variable with mean and standard deviation .
Q: Let's use the the data above for male kestrel length. Here are the data again, but sorted to help…
A: First, we need to calculate mean and SD of the given data on male kestrel length.Sample size (n) =…
Q: Assume a member is selected at random from the population represented by the graph. Find the…
A: We have given a standard normal distribution curve with-Population mean μ = 19.6Population standard…
Q: Find the limiting distribution for this Markov chain. Without doing any more calculations, what can…
A: Let the markov chain with state space and the transition probability matrix is given by,
Q: Women's heights are normally distributed with mean 63.7 in. and standard deviation 2.9 in. = 21.…
A: Mean = 63.7 inchStandarad deviation =2.9 inch
Q: A small town consisting of 2,732 households requires pet licenses for dogs and cats. Let the…
A: Let letter A denote group 1 and B denote group 2.Given that:Total number of households N =…
Q: 18 prisoners were randomly selected for burglary convictions. 10 White prisoners and 8 Black…
A:
Q: In a recent study on world happiness, participants were asked to evaluate their current lives on a…
A:
Q: Which type of confidence interval should you use in this situation? A sample of 25 different payroll…
A: Sample size (n) = 25 payroll departmentsSample mean (x¯) = 310.3 daysSample standard deviation (s) =…
Q: instructor believes that students take more than 2 classes per quarter on averag viewed a class of…
A: Sample size n=24Sample mean=2.3Standard deviation=0.8
Q: In a survey of 2591 adults in a recent year 1414, say they have made a New Year's resolution.…
A: From the provided information,Confidence level = 90% and 95%
Q: A marketing researcher is hired by a corporation to conduct a study and estimate the population mean…
A: The question is about sample size estimation.Given : Maximum error ( E ) = 5Standard deviation of…
Q: In the multichannel model (M/M/m), we must assume that the average service time for all channels is…
A: The M/M/m channel is one of the queuing systems used in the operational research field.
Q: a) Find the value of ‘*’ and Find the expected category of hurricane to make landfall, E(X). What…
A: xP(X=x)10.4120.3430.1340.075*
Q: Using all 1991 birth records in the computerized national birth certificate registry compiled by the…
A: Let X be the birth weight of an infant.Want to calculate probability?
Q: what is the probability of getting 0 defective calculators
A: Number of defective calculators = 13Number of non defective calculators = 39Total number of…
Q: The following table shows the number of individuals in a sample of 450 who indicated they support…
A: Total = 450
Q: How much should a healthy kitten weigh? Suppose that a healthy 10-week-old (domestic) kitten should…
A: Since you have posted a question with multiple subparts, we will provide solution to the first three…
Q: Thickness measurements of ancient prehistoric Native American pot shards discovered in a Hopi…
A: Mean()=4.8Standard deviation()=1.6
Q: Use the BMI’s to construct a modified boxplot. 15.9 19.3 19.4 20 20.1 21.0 21.0…
A: 15.9, 19.3, 19.4, 20, 20.1, 21.0, 21.0, 21.6, 21.6, 23.2, 24.5, 24.6, 24.8, 25.5, 25.8, 25.8, 25.9,…
Q: If you roll two dice what’s the probability of rolling a seven the numbers on the dice add up to…
A: we roll two dice total possibilities = 62=36all outcomes are equally likely
Q: hat(1) Read the Z table AND make a sketch. P(01.84) P(Z -1.84 = =
A: Here we have to computeP(Z<-1.84)P(Z<1.84)P(Z>-1.84)
Q: Macmillan Learning Choose an adult age 18 or over in the United States at random and ask, "How many…
A: For the variable "X as the number of cups of coffee is drunk on average per day", the probability…
Q: For any probability density function, what value is always the total area under the curve? Choose…
A: For any probability density function , total area under curve = ?
Q: A normal distribution has a mean of 35 and a standard deviation of 4. Find the probability that a…
A: Given,Mean, μ = 35Standard deviation, σ = 4Using formula (Empirical rule),Empirical rule states…
Q: Which of the following sampling methods will likely produce a sample that is biased and not…
A: The objective is to identify the sampling technique that produces a sample that is biased and not…
Q: Pulmonary Disease. Suppose a 1980 study was conducted whose purpose was to compare the indoor air…
A: The question is about hypothesis testing.Given :No. of work areas where smoking was permitted ( n1 )…
Q: Find the margin of error for the given values of c, s, and n. c=0.95, s=6, n=15
A:
Q: A food safety guideline is that the mercury in fish should be below 1 part per million (ppm). Listed…
A: The amounts of mercury found in tuna sushi sampled at different stores in a city are given…
Q: Porphyrin is a pigment in blood protoplasm and other body fluids that is significant in body energy…
A: We have given that Mean() = 43Standard deviations () = 10
Q: alf the staff at Honeydukes argue that all their candy is liked equally by all customers. The other…
A: The population of interest here are all the customers of Honeydukes.To test:Null hypothesis: All the…
Q: You have a bag of 8 colored marbles. Of these 8 marbles, 4 are red and 4 are blue? What is the…
A: There are 8 marbles.Out of these, 4 are blue and 4 are red. The selection of blue marble is…
Q: Movieflix, an online movie streaming service that offers a wide variety of award-winning TV shows,…
A: YearAdvertising…
Q: 236. A sample of the number of study hours per week of college students is collected. Some of the…
A: The sample results of the survey are given as Study hoursZ-score percentile…
Q: Calculate the minimum sample size that you must have to meet these requirements.
A: Let p be the pop. prop. of college students in the state who receive the form of financial aid.Given…
Q: researcher was hired to estimate the proportion of American households that have broadband internet…
A: following 95% confidence interval.0.461<p<0.541We have to find sample size
Q: 1. Fix r € N, and suppose that Y₁,..., Yn are independent and identically distributed NegBin(r, )…
A: Given that are independent and identically distributed random variables, each with probability…
Trending now
This is a popular solution!
Step by step
Solved in 3 steps
- Due to COVID19, airlines cut services, such as meals and snacks during flights, and started charging for luggage. However, they are still concerned about service. A group of four carriers hired Denny's Marketing Research Inc. to survey passengers regarding their level of satisfaction with a recent flight. The survey included questions on ticketing, boarding, in-flight service, baggage handling, pilot communication, and so forth. Twenty-five questions offered a range of possible answers: excellent, good, fair, or poor. A response of excellent was given a score of 4, good a 3, fair a 2, and poor a 1. These responses were then totaled, so the total score was an indication of the satisfaction with the flight. The greater the score, the higher the level of satisfaction with the service. The highest possible score was 100. Denny randomly selected and surveyed passengers from the four airlines. Below is the sample information. Is there a difference in the mean satisfaction level among the…In a trial of a new allergy medicine, 85 people were given the medicine and 85 were given a placebo. Of those given the medicine, 60 showed improvement in their allergy symptoms. Of those given the placebo, 55 did not show improvement. Complete parts (a) through (d) below. a. Make a two-way table summarizing the reviews. Improvement No Improvement Medicine 25 Placebo 30 (Type whole numbers.)The Stanford open policy and project gathers, analyzes, and release his records for traffic stops by law-enforcement agencies across the United States. Their goal is to help researchers, journalist, and policymakers investigate and improve interactions between police and the public. The following is an excerpt From a summary table created based off of the data collected as part of the project (a) what variables were collected on each individual traffic stop in order to create to the summary table above (b) State whether each variable is numerical or categorical. If numerical state whether it is continuous or discrete. If categorical state whether it’s ordinal or not. (C) suppose we want to evaluate whether vehicle search rates are different for drivers of different races. And this Analysis, Which variable would be the response variable and which we would be the explanatory variable?
- Gaucher, Friesen, and Kay (2010) found that masculine-themed words (such ascompetitive, independent, analyze, strong) are commonly used in job recruitmentmaterials, especially for job advertisements in male-dominated areas. In a similarstudy, a researcher counted the number of masculine-themed words in jobadvertisements for job areas, and obtained the following data.Area Number of Masculine WordsPlumber 14Electrician 12Security guard 17Bookkeeper 9Nurse 6Early-childhood educator 7Determine what kind of graph would be appropriate for showing this distribution andsketch the frequency distribution graph.An owner of an ice cream shop wants to investigate whether a new training program affects the scooping skills of ice cream shop employees. To assess this, the owner divides employees into two groups: those who receive training (CT) and those who do not (NT). The owner evaluates their scooping skills using a scooping proficiency test. The dataset includes the test scores of the NT (no training) group: 15.00, 7.00, 18.00, 10.00, 6.00, and 20.00, and the CT (trained) group: 15.00, 10.00, 14.00, 7.00, 21.00, and 21.00. The owner is aware of the known population mean for scooping proficiency, which is 20. The hypothesis is that employees who did not receive training (NT) will likely have lower scooping proficiency than the population mean. To investigate this hypothesis, the owner conducts a one-sample t-test with a significance level (alpha) set at 0.05. The objective is to determine if the mean scooping proficiency of the NT group is significantly different from the established population…An owner of an ice cream shop wants to investigate whether a new training program affects the scooping skills of ice cream shop employees. To assess this, the owner divides employees into two groups: those who receive training (CT) and those who do not (NT). The owner evaluates their scooping skills using a scooping proficiency test. The dataset includes the test scores of the NT (no training) group: 15.00, 7.00, 18.00, 10.00, 6.00, and 20.00, and the CT (trained) group: 15.00, 10.00, 14.00, 7.00, 21.00, and 21.00. The owner is aware of the known population mean for scooping proficiency, which is 20. The hypothesis is that employees who did not receive training (NT) will likely have lower scooping proficiency than the population mean. To investigate this hypothesis, the owner conducts a one-sample t-test with a significance level (alpha) set at 0.05. The objective is to determine if the mean scooping proficiency of the NT group is significantly different from the established population…
- An owner of an ice cream shop wants to investigate whether a new training program affects the scooping skills of ice cream shop employees. To assess this, the owner divides employees into two groups: those who receive training (CT) and those who do not (NT). The owner evaluates their scooping skills using a scooping proficiency test. The dataset includes the test scores of the NT (no training) group: 15.00, 7.00, 18.00, 10.00, 6.00, and 20.00, and the CT (trained) group: 15.00, 10.00, 14.00, 7.00, 21.00, and 21.00. The owner is aware of the known population mean for scooping proficiency, which is 20. The hypothesis is that employees who did not receive training (NT) will likely have lower scooping proficiency than the population mean. To investigate this hypothesis, the owner conducts a one-sample t-test with a significance level (alpha) set at 0.05. The objective is to determine if the mean scooping proficiency of the NT group is significantly different from the established population…An owner of an ice cream shop wants to investigate whether a new training program affects the scooping skills of ice cream shop employees. To assess this, the owner divides employees into two groups: those who receive training (CT) and those who do not (NT). The owner evaluates their scooping skills using a scooping proficiency test. The dataset includes the test scores of the NT (no training) group: 15.00, 7.00, 18.00, 10.00, 6.00, and 20.00, and the CT (trained) group: 15.00, 10.00, 14.00, 7.00, 21.00, and 21.00. The owner is aware of the known population mean for scooping proficiency, which is 20. The hypothesis is that employees who did not receive training (NT) will likely have lower scooping proficiency than the population mean. To investigate this hypothesis, the owner conducts a one-sample t-test with a significance level (alpha) set at 0.05. The objective is to determine if the mean scooping proficiency of the NT group is significantly different from the established population…An owner of an ice cream shop wants to investigate whether a new training program affects the scooping skills of ice cream shop employees. To assess this, the owner divides employees into two groups: those who receive training (CT) and those who do not (NT). The owner evaluates their scooping skills using a scooping proficiency test. The dataset includes the test scores of the NT (no training) group: 15.00, 7.00, 18.00, 10.00, 6.00, and 20.00, and the CT (trained) group: 15.00, 10.00, 14.00, 7.00, 21.00, and 21.00. The owner is aware of the known population mean for scooping proficiency, which is 20. The hypothesis is that employees who did not receive training (NT) will likely have lower scooping proficiency than the population mean. To investigate this hypothesis, the owner conducts a one-sample t-test with a significance level (alpha) set at 0.05. The objective is to determine if the mean scooping proficiency of the NT group is significantly different from the established population…
- An owner of an ice cream shop wants to investigate whether a new training program affects the scooping skills of ice cream shop employees. To assess this, the owner divides employees into two groups: those who receive training (CT) and those who do not (NT). The owner evaluates their scooping skills using a scooping proficiency test. The dataset includes the test scores of the NT (no training) group: 15.00, 7.00, 18.00, 10.00, 6.00, and 20.00, and the CT (trained) group: 15.00, 10.00, 14.00, 7.00, 21.00, and 21.00. The owner is aware of the known population mean for scooping proficiency, which is 20. The hypothesis is that employees who did not receive training (NT) will likely have lower scooping proficiency than the population mean. To investigate this hypothesis, the owner conducts a one-sample t-test with a significance level (alpha) set at 0.05. The objective is to determine if the mean scooping proficiency of the NT group is significantly different from the established population…An owner of an ice cream shop wants to investigate whether a new training program affects the scooping skills of ice cream shop employees. To assess this, the owner divides employees into two groups: those who receive training (CT) and those who do not (NT). The owner evaluates their scooping skills using a scooping proficiency test. The dataset includes the test scores of the NT (no training) group: 15.00, 7.00, 18.00, 10.00, 6.00, and 20.00, and the CT (trained) group: 15.00, 10.00, 14.00, 7.00, 21.00, and 21.00. The owner is aware of the known population mean for scooping proficiency, which is 20. The hypothesis is that employees who did not receive training (NT) will likely have lower scooping proficiency than the population mean. To investigate this hypothesis, the owner conducts a one-sample t-test with a significance level (alpha) set at 0.05. The objective is to determine if the mean scooping proficiency of the NT group is significantly different from the established population…The following data includes the year, make, model, mileage (in thousands of miles) and asking price (in US dollars) for each of 13 used Honda Odyssey minivans. The data was collected from the Web site of the Seattle P-I on April 25, 2005. year make model mileage price 2004 Honda Odyssey EXL 20 26900 2004 Honda Odyssey EX 21 23000 2002 Honda Odyssey 33 17500 2002 Honda Odyssey 41 18999 2001 Honda Odyssey EX 43 17200 2001 Honda Odyssey EX 67 18995 2000 Honda Odyssey LX 46 13900 2000 Honda Odyssey EX 72 15250 2000 Honda Odyssey EX 82 13200 2000 Honda Odyssey 99 11000 1999 Honda Odyssey 71 13900 1998 Honda Odyssey 85 8350 1995 Honda Odyssey EX 100 5800 Compute the correlation between mileage and price for these minivans. (Assume the correlation conditions have been satisfied and round your answer to the nearest 0.001.)r=