MATLAB: An Introduction with Applications
6th Edition
ISBN: 9781119256830
Author: Amos Gilat
Publisher: John Wiley & Sons Inc
expand_more
expand_more
format_list_bulleted
Question
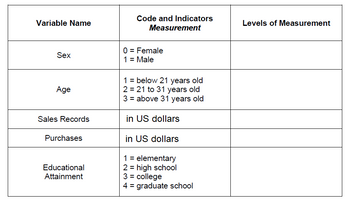
identify the levels of measurement of the following variables and explain

Transcribed Image Text:Variable Name
Sex
Age
Sales Records
Purchases
Educational
Attainment
Code and Indicators
Measurement
0 = Female
1 = Male
1 = below 21 years old
2 = 21 to 31 years old
3 = above 31 years old
in US dollars
in US dollars
1 = elementary
2 = high school
3 = college
4 = graduate school
Levels of Measurement
Expert Solution
This question has been solved!
Explore an expertly crafted, step-by-step solution for a thorough understanding of key concepts.
Step by stepSolved in 2 steps

Knowledge Booster
Similar questions
- Joan's Nursery specializes in custom-designed landscaping for residential areas. The estimated labor cost associated with a particular landscaping proposal is based on the number of plantings of trees, shrubs, and so on to be used for the project. For cost-estimating purposes, managers use two hours of labor time for the plant- ing of a medium-sized tree. Actual times from a sample of 10 plantings during the past month follow (times in hours).2.1 2.2 1.7 1.6 2.3 3.1 1.5 2.6 2.4 2.2 With a .05 level of significance, test to see whether the mean tree-planting time differs from two hours. a. State the null and alternative hypotheses. b. Compute the sample mean. c. Compute the sample standard deviation. d. What is the p-value? e. What is your conclusion?arrow_forwardThe data used is from college campuses. The variables used in the analysis below include: crime, total campus crime; enroll, total enrollment; police, employed officers. Use the estimated OLS models to answer the questions below: Model A: In(crime) = -6.631 + 1.270ln(enroll), (1.034) (.110) n = 97; R² = .5804 Model B: In(crime) = -4.794 + .923ln(enroll) (.144) (1.112) n = 97; R² = .632 +.516ln(police), (.149) Using Model A, test the null hypothesis that elasticity of crime with respect to enrollment is unit elastic, i.e. equal to one (against a two-sided alternative). Calculate the t-statistic.arrow_forwardcalculate r and r2 and report the results in APA stylearrow_forward
- 1. Identify whether the variable in the information below is qualitative or quantitative. A nurse collects blood from kids and measure their blood-sugar content. This measure of blood-sugar concentration is a variable. a. quantitative b. qualitative c. qualitative as well as quantitative d. neither qualitative nor quantitative 2. Identify the technique for gathering data in the study below. A pharmaceutical firm wants test the effectiveness of a new drug. It wants to know if the new drug is significantly stronger than the conventional drug. This is a/an study. a. observational b. experimental c. census d. sampling 3. You want to plot a frequency graph of daily rainfall, with rainfalls (inches) on the horizontal axis. You will use a a. bar chart b. histogram c. cumulative frequency d. best fit line 4. Frequency of categorical data are displayed using a a. bar chart b. histogram c. time series graph d. best fit linearrow_forwardData was collected for a sample of organic snacks. The amount of sugar (in mg) in each snack is summarized in the histogram below. Which statement below best describes the meaning of the second bin (or class)? A. There were 65 snacks that contained 2 milligrams of sugar. B. There were 2 snacks that contained between 65 and 70 milligrams of sugar. C. There were 2 snacks that contained 65 milligrams of sugar. D. There were between 65 and 70 snacks that contained 2 milligrams of sugar. E. There were 2 snacks that contained 70 milligrams of sugar. F. There were 70 snacks that contained 2 milligrams of sugar.arrow_forwardState the empirical rule for variables.arrow_forward
arrow_back_ios
arrow_forward_ios
Recommended textbooks for you
 MATLAB: An Introduction with ApplicationsStatisticsISBN:9781119256830Author:Amos GilatPublisher:John Wiley & Sons Inc
 Probability and Statistics for Engineering and th...StatisticsISBN:9781305251809Author:Jay L. DevorePublisher:Cengage Learning
 Statistics for The Behavioral Sciences (MindTap C...StatisticsISBN:9781305504912Author:Frederick J Gravetter, Larry B. WallnauPublisher:Cengage Learning
 Elementary Statistics: Picturing the World (7th E...StatisticsISBN:9780134683416Author:Ron Larson, Betsy FarberPublisher:PEARSON
 The Basic Practice of StatisticsStatisticsISBN:9781319042578Author:David S. Moore, William I. Notz, Michael A. FlignerPublisher:W. H. Freeman
 Introduction to the Practice of StatisticsStatisticsISBN:9781319013387Author:David S. Moore, George P. McCabe, Bruce A. CraigPublisher:W. H. Freeman

MATLAB: An Introduction with Applications
Statistics
ISBN:9781119256830
Author:Amos Gilat
Publisher:John Wiley & Sons Inc

Probability and Statistics for Engineering and th...
Statistics
ISBN:9781305251809
Author:Jay L. Devore
Publisher:Cengage Learning

Statistics for The Behavioral Sciences (MindTap C...
Statistics
ISBN:9781305504912
Author:Frederick J Gravetter, Larry B. Wallnau
Publisher:Cengage Learning

Elementary Statistics: Picturing the World (7th E...
Statistics
ISBN:9780134683416
Author:Ron Larson, Betsy Farber
Publisher:PEARSON

The Basic Practice of Statistics
Statistics
ISBN:9781319042578
Author:David S. Moore, William I. Notz, Michael A. Fligner
Publisher:W. H. Freeman

Introduction to the Practice of Statistics
Statistics
ISBN:9781319013387
Author:David S. Moore, George P. McCabe, Bruce A. Craig
Publisher:W. H. Freeman