
MATLAB: An Introduction with Applications
6th Edition
ISBN: 9781119256830
Author: Amos Gilat
Publisher: John Wiley & Sons Inc
expand_more
expand_more
format_list_bulleted
Related questions
Question
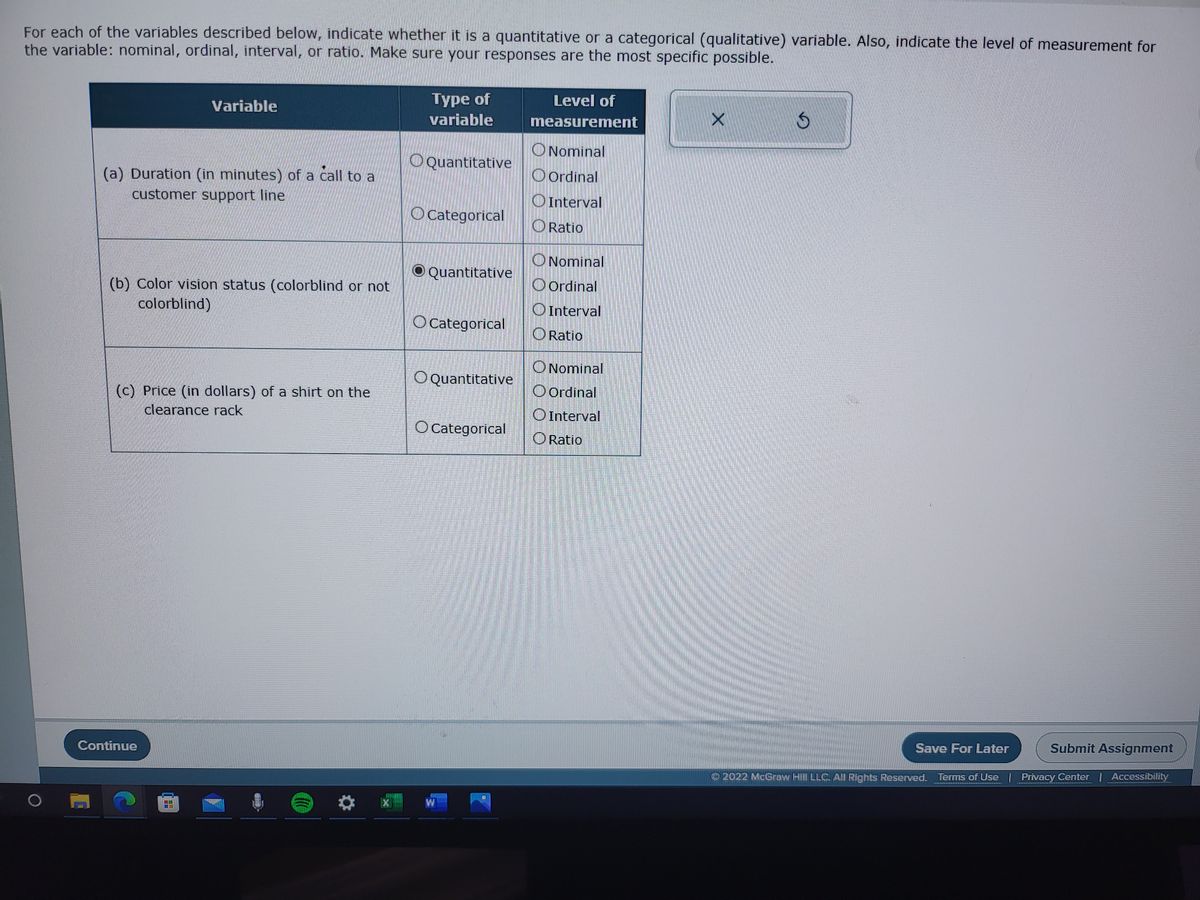

Transcribed Image Text:**Understanding Variable Types and Levels of Measurement**
This educational resource explains how to classify variables as either quantitative or categorical, and identify their levels of measurement.
### Variable Classification
1. **Duration of a Call to Customer Support Line**
- **Type of Variable**: Quantitative
- **Level of Measurement**: Ratio
- **Explanation**: The duration of a call is a numerical measurement that has a true zero point, meaning a call can be zero minutes long. It demonstrates the ratio level of measurement, as differences and ratios are meaningful.
2. **Color Vision Status (Colorblind or Not Colorblind)**
- **Type of Variable**: Categorical
- **Level of Measurement**: Nominal
- **Explanation**: Color vision status is a categorical variable with no intrinsic order, classified nominally. It simply distinguishes between colorblind and not colorblind without suggesting any ranking.
3. **Price of a Shirt on the Clearance Rack**
- **Type of Variable**: Quantitative
- **Level of Measurement**: Ratio
- **Explanation**: The price of a shirt is a numeric variable that can be assessed in terms of how much more one shirt costs over another. This ratio level allows for comparing differences and computing ratios.
### Key Concepts
- **Quantitative Variables**: These are numerical and can be measured in terms of magnitude. Commonly assessed using interval or ratio measurements.
- **Categorical (Qualitative) Variables**: These describe qualities or categories. They are classified using nominal or ordinal scales.
- **Nominal Level**: Used for labeling variables without any quantitative value (e.g., gender, color vision status).
- **Ordinal Level**: Reflects ordered categories but does not specify the distance between them.
- **Interval Level**: Uses numerical values to show order, but lacks a true zero point (e.g., temperature in Celsius).
- **Ratio Level**: Similar to interval, but with a meaningful zero, allowing for the calculation of ratios (e.g., duration, price).
This understanding is crucial for analyzing data accurately in studies and research.
Expert Solution
This question has been solved!
Explore an expertly crafted, step-by-step solution for a thorough understanding of key concepts.

This is a popular solution

Trending nowThis is a popular solution!

Step by stepSolved in 3 steps

Knowledge Booster

Similar questions
- Quantitative data can provide precise measurements and comparisons A) True B Falsearrow_forwardFor each of the variables described below, indicate whether it is a quantitative or a categorical (qualitative) variable. Also, indicate the level of measurement for the variable: nominal, ordinal, interval, or ratio. Make sure your responses are the most specific possible. Variable Type of variable Level of measurement (a)Duration (in minutes) of a call to a customer support line Quantitative Categorical Nominal Ordinal Interval Ratio (b)Exchange on which a stock is traded (NYSE, AMEX, or other) Quantitative Categorical Nominal Ordinal Interval Ratio (c)Temperature (in degrees Celsius) Quantitative Categorical Nominal Ordinal Interval Ratioarrow_forwardPlease answer the question in the picture below with the information providedarrow_forward
- Determine the type of data being collected and classify each data sets level of measurement Monthly salaries of CEO’s in the United States Data type : Qualitative, Quantitative Continuous, or Quantitative Discrete Level of Measurement: Qualitative, Quantitative Continuous, or Quantitative Discretearrow_forwardWhat kind of variables you need to calculate a t-statistic (scale of measurement)arrow_forwardVariables Mean SD Honesty Profanity self-report Profanity used Honesty 7.63 3.00 (0.79) Profanity self-report 6.51 2.56 0.34*** (0.84) Profanity used 4.09 2.61 0.20** 0.46*** (-) Profanity liked 1.60 1.62 0.13* 0.41*** 0.45*** Which pait of variables showed the weakest relation based on their correlation coefficient?arrow_forward
- Try Again Your answer is incorrect. • Some of the frequencies are incorrect. The following is a list of P/E ratios (current stock price divided by company's earnings per share) for 21 companies. 57, 53, 50, 46, 42, 35, 31, 56, 52, 49, 45, 41, 37, 48, 48, 48, 44, 44, 40, 40, 40 Send data to calculator Draw the histogram for these data using an initial class boundary of 30.5 and a class width of 6. Note that you can add or remove classes from the figure. Label each class with its endpoints. Frequency 8- 7. ? 6+ 5- 4- 2 2- 30.5 36.5 42.5 48.5 54.5 60.5 "PEratio 2.arrow_forwardWhat type if variable is color vision status categorical or quantitativearrow_forwardI need full answer to complete question include a, b and c.arrow_forward
- Each year the proportion of named storms that make landfall in the United States is calculated. Based on this, the proportion of named storms that make landfall in the United States is what type of characteristic? Discrete quantitative variable Constant Continuous quantitative variable Categorical variable 000arrow_forwardTYPEWRITTEN ONLY PLEASE FOR UPVOTE. DOWNVOTE FOR HANDWRITTEN. DO NOT ANSWER IF YOU ALREADY ANSWERED THISarrow_forwardHow much would you expect systolic blood pressure to change if a person commits to reducing their cigarette consumption by 1 cigarette per day?arrow_forward
arrow_back_ios
SEE MORE QUESTIONS
arrow_forward_ios
Recommended textbooks for you
- MATLAB: An Introduction with ApplicationsStatisticsISBN:9781119256830Author:Amos GilatPublisher:John Wiley & Sons Inc
 Probability and Statistics for Engineering and th...StatisticsISBN:9781305251809Author:Jay L. DevorePublisher:Cengage Learning
 Statistics for The Behavioral Sciences (MindTap C...StatisticsISBN:9781305504912Author:Frederick J Gravetter, Larry B. WallnauPublisher:Cengage Learning
  Elementary Statistics: Picturing the World (7th E...StatisticsISBN:9780134683416Author:Ron Larson, Betsy FarberPublisher:PEARSON
 The Basic Practice of StatisticsStatisticsISBN:9781319042578Author:David S. Moore, William I. Notz, Michael A. FlignerPublisher:W. H. Freeman
 Introduction to the Practice of StatisticsStatisticsISBN:9781319013387Author:David S. Moore, George P. McCabe, Bruce A. CraigPublisher:W. H. Freeman
MATLAB: An Introduction with Applications
Statistics
ISBN:9781119256830
Author:Amos Gilat
Publisher:John Wiley & Sons Inc
Probability and Statistics for Engineering and th...
Statistics
ISBN:9781305251809
Author:Jay L. Devore
Publisher:Cengage Learning
Statistics for The Behavioral Sciences (MindTap C...
Statistics
ISBN:9781305504912
Author:Frederick J Gravetter, Larry B. Wallnau
Publisher:Cengage Learning
Elementary Statistics: Picturing the World (7th E...
Statistics
ISBN:9780134683416
Author:Ron Larson, Betsy Farber
Publisher:PEARSON
The Basic Practice of Statistics
Statistics
ISBN:9781319042578
Author:David S. Moore, William I. Notz, Michael A. Fligner
Publisher:W. H. Freeman
Introduction to the Practice of Statistics
Statistics
ISBN:9781319013387
Author:David S. Moore, George P. McCabe, Bruce A. Craig
Publisher:W. H. Freeman