
MATLAB: An Introduction with Applications
6th Edition
ISBN: 9781119256830
Author: Amos Gilat
Publisher: John Wiley & Sons Inc
expand_more
expand_more
format_list_bulleted
Related questions
Question
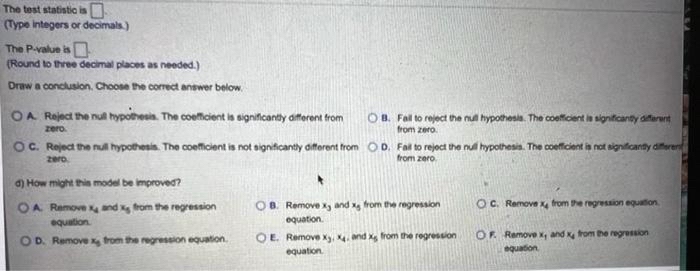

Transcribed Image Text:The test statistic is
(Type integers or decimals.)
The P-value is.
(Round to three decimal places as needed.)
Draw a conclusion. Choose the correct answer below.
OA Reject the nul hypothesis. The coefficient is significantly different from
OB. Fal to reject the nul hypothesia. The coeficient in significanty diferent
from zero.
zero.
OC. Reject the null hypothesis. The coeficient is not significantly different from OD. Fal to rejoct the null hypothesis. The coeficient is not significantly differen
2ero
from zero
d) How might this model be improved?
OA Remove x and from the regression
OB. Remove x, and x from the regression
OC. Remove x from the regression equation.
equation
equation.
OE. Remove Xy, . and Xg from the regression
equation
OF Remove x, and K trom the regression
equation
OD. Remove trom the regression equation.

Transcribed Image Text:Variable
Coef
9.853
Std. Error
t-value
A study of 30 secretaries' yearly salaries (in thousands of dollars) was done. The researchers Intercept
want to predict salaries from several other variables. The variables considered to be potential X1
predictors of salary are months of service (x,). years of education (x2), score on a
standardized test (x3), words per minute (wpm) typing speed (X4). and ability to take dictation x,
in words per minute (Xs). A multiple regression model with all five variables was run.
0.373
26.416
0.112
0.013
8.615
0.066
0.029
2.276
0.093
0.031
3.000
0.008
0.306
0.026
0.063
0.022
2.864
Assume that the residual plots show no violations of the conditions for using a linear regression model.
a) What is the regression equation?
(Use integers or decimals for any numbers in the expression. Do not round.)
) From this model what is the predicted salary y (in thousands of dollars) of a secretary with 11 years (132 months) of experience, 12h grade education (12 yeurs of
education), a 46 on the standardized test, 63 wpm typing speed, and the ability to take 32 wpm dictation?
The predicted salary is houand dollars.
(Round to one decimal place a needed)
e) Test whether the coefficient of words per minute of typing speed () is significiney different from zero at a0.05.
Fist state the nu and altemative hypotheses. Choose the corect hypotheses below.
OAMAOO
OB HO
OC. H: 0
Expert Solution
This question has been solved!
Explore an expertly crafted, step-by-step solution for a thorough understanding of key concepts.

Step by stepSolved in 5 steps with 3 images

Knowledge Booster

Similar questions
- True or false - The number of languages a person can speak is a nominal variable, therefore we cannot calculate its median.arrow_forwardA doctor notes the variables listed in the following table from every patient before admitting in his hospital. Which of the following variables are qualitative and which are quantitative? Which qualitative variables are nominal or ordinal? Which quantitative variables are discrete or continuous? ( 1 ) Gender (Male or Female) ( 2 ) Weight (lbs) ( 3 ) Phone Number ( 4 ) Height (cm) ( 5 ) Marital Status (Single, Married, Divorce, Widow) ( 6 ) Systolic Blood Pressure (mm of pressure) ( 7 ) Temperature (degree F) ( 8 ) Level of Calcium (microgram/milimeter) ( 9 ) Family of Income ( Amount) ( 10 ) Wihte Blood Cellsarrow_forwardpls help! Cell phone production engineers have noticed that among a group of 138 customers aged 14-23 who send more text messages tend to use a higher percentage of their phone’s memory. What are the explanatory variable and response variable for this relationship? Explanatory variable: age of customerResponse variable: percentage of phone memory used Explanatory variable: percentage of phone memory usedResponse variable: age of customer Explanatory variable: number of text messages sentResponse variable: percentage of phone memory used Explanatory variable: percentage of phone memory usedResponse variable: number of text messages sentarrow_forward
- ec5arrow_forwardWhat are two variables that will be can be used in a chi-square analysis based in social work? What would the best attributes be for each variable?arrow_forwardYou are a big soccer fan and you decide to gather information on the goal differential (goals scored - goals allowed) for your favorite team in the Premier League during the last season. You find that the average goal differential for home games (games that take place on the team's own stadium) was 1.37 and the average goal differential for away games (games that take place on the opponent team's stadium) was 0.32. With the data you have, if you regress goal differential (call it variable G) on a dummy variable (call it variable D) that takes the value 1 if the game is a home game and takes the value zero if the game is an away game, and obtain Ĝi = Bo + B₁ D₁, then, Bo will be equal to equal to and ₁ will bearrow_forward
- I need to the right answer for this please.arrow_forwardSuppose you have access to a database with the variables listed below. Using the two variables BMI(the predictor) and diabetes(the outcome) Name two types of descriptive statistics you could report specifying the variables BMI and diabetes.arrow_forwardSuppose the observational units in a study are the patients arriving at an emergency room on a given day, Nov 11, 2019. Number of patients that arrive before noon is a qualitative variable is a quantitative variable is not a variablearrow_forward
- 10) The top point in the scatter plot (6.5, 1459) is for Washington, DC. Find the predicted DC violent crime rate if x=6.5. Then find the residual for DC using the predicted violence crime rate and the actual violent crime rate (the actual crime rate is provided in the first sentence of this question). Prediction = Actual y-value = Residual =arrow_forwardQuestion8arrow_forwardjake suspects that individuals with an optimistic world view live longer than individuals with a pessimistic view. Sate the research hypothesis the null hypothesis cases independent variable dependent variablearrow_forward
arrow_back_ios
SEE MORE QUESTIONS
arrow_forward_ios
Recommended textbooks for you
- MATLAB: An Introduction with ApplicationsStatisticsISBN:9781119256830Author:Amos GilatPublisher:John Wiley & Sons Inc
 Probability and Statistics for Engineering and th...StatisticsISBN:9781305251809Author:Jay L. DevorePublisher:Cengage Learning
 Statistics for The Behavioral Sciences (MindTap C...StatisticsISBN:9781305504912Author:Frederick J Gravetter, Larry B. WallnauPublisher:Cengage Learning
  Elementary Statistics: Picturing the World (7th E...StatisticsISBN:9780134683416Author:Ron Larson, Betsy FarberPublisher:PEARSON
 The Basic Practice of StatisticsStatisticsISBN:9781319042578Author:David S. Moore, William I. Notz, Michael A. FlignerPublisher:W. H. Freeman
 Introduction to the Practice of StatisticsStatisticsISBN:9781319013387Author:David S. Moore, George P. McCabe, Bruce A. CraigPublisher:W. H. Freeman
MATLAB: An Introduction with Applications
Statistics
ISBN:9781119256830
Author:Amos Gilat
Publisher:John Wiley & Sons Inc
Probability and Statistics for Engineering and th...
Statistics
ISBN:9781305251809
Author:Jay L. Devore
Publisher:Cengage Learning
Statistics for The Behavioral Sciences (MindTap C...
Statistics
ISBN:9781305504912
Author:Frederick J Gravetter, Larry B. Wallnau
Publisher:Cengage Learning
Elementary Statistics: Picturing the World (7th E...
Statistics
ISBN:9780134683416
Author:Ron Larson, Betsy Farber
Publisher:PEARSON
The Basic Practice of Statistics
Statistics
ISBN:9781319042578
Author:David S. Moore, William I. Notz, Michael A. Fligner
Publisher:W. H. Freeman
Introduction to the Practice of Statistics
Statistics
ISBN:9781319013387
Author:David S. Moore, George P. McCabe, Bruce A. Craig
Publisher:W. H. Freeman