
Human Anatomy & Physiology (11th Edition)
11th Edition
ISBN: 9780134580999
Author: Elaine N. Marieb, Katja N. Hoehn
Publisher: PEARSON
expand_more
expand_more
format_list_bulleted
Related questions
Concept explainers
Question
Using the data and graph below, answer these questions completely and correctly:
5. Based on your data in Table 2 and Figure 2., how do rainfall/temperature correlate with productivity/diversity in biomes?
6. Suggest a hypothesis to explain the correlation in question 5.
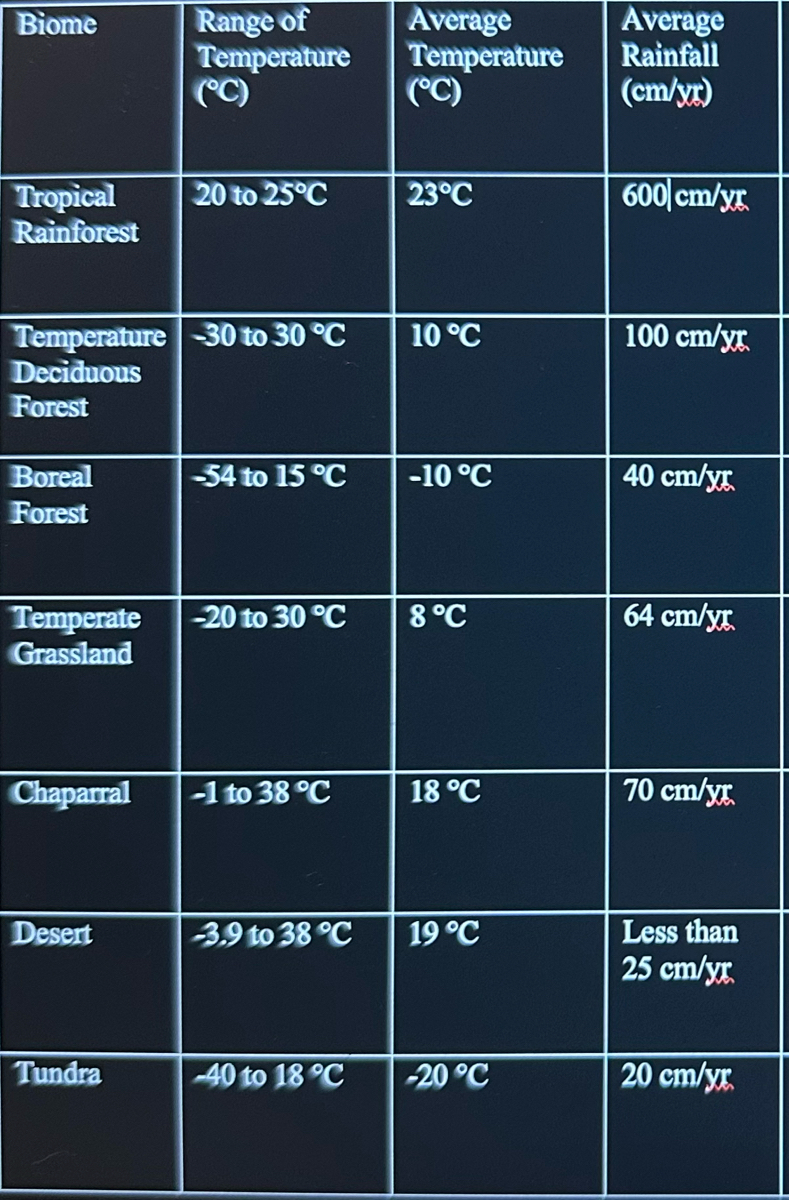

Transcribed Image Text:Biome
Tropical
Rainforest
Boreal
Forest
Temperature -30 to 30 °C
Deciduous
Forest
Temperate
Grassland
Chaparral
Desert
Range of
Temperature
(°C)
Tundra
20 to 25°C
-54 to 15 °C
-20 to 30 °C
-1 to 38 °C
-3.9 to 38 °C
-40 to 18 °C
Average
Temperature
(°C)
23°C
10 °℃
-10 °C
8 °C
18 °C
19 °C
-20 °C
Average
Rainfall
(cm/yr)
600 cm/yx
100 cm/yr.
40 cm/xx.
64 cm/yx.
70 cm/yx.
Less than
25 cm/yx.
20 cm/yx.

Transcribed Image Text:Tundra
-30
Average Rainfall
Bored
forest
Goo
-20
520
480
440
460
360
320-
2280
240.
200
166-
/120-
80
40-
Tundra.
0
10
10
Average Temperature
Temperate deciduous forut
chapparal
Temperate
grassland » Desert
20
Bo
2
Expert Solution
This question has been solved!
Explore an expertly crafted, step-by-step solution for a thorough understanding of key concepts.

This is a popular solution

Trending nowThis is a popular solution!

Step by stepSolved in 3 steps

Knowledge Booster


Learn more about
Need a deep-dive on the concept behind this application? Look no further. Learn more about this topic, biology and related others by exploring similar questions and additional content below.Similar questions
- Suppose you were given the task of estimating the density of two plant species in a field. Based on the life histories of the two species, you expect that the spatial distribution of one of the species is approximately uniform, whereas the other is likely to be clumped. How might your approach to estimating the density of these two species differ?arrow_forwardLevels of CO2 and methane in the atmosphere have been increasing over the years. What effect is this having on conditions on Earth? A. Allowing too much heat to escape into space. B. Leading to a rise in global temperatures. C. Interfering with the uptake of phosphorus gases by primary producers. D. Increasing the rate of biological magnification. Reset Selectionarrow_forwardWhich of the scenarios below illustrate(s) a trade off relating to functional diversity and life history traits? Select all that apply A- The C3 photosynthetic pathway is more energy efficient than C4 and CAM, but less water efficient. B-Plants that produce large seeds generally produce very few, while plants that produce small seeds generally produce many of them. C- Indices of species diversity rely both on species richness and species evenness, but not on species relatedness D- Endothermic animals are better able to maintain their preferred body temperature than ectothermic animals, but expend a large amount of metabolic energy to do so. E- Organisms that specialize on a single food source may use that resource more efficiently than generalists, but risk starvation if unable to find their particular food source.arrow_forward
- Identify the dependent and independent variables in the following examples: -The growth of bacterial populations is measured in cold, medium, and high temperatures. -Guinea pigs are kept at different temperatures for 6 weeks. Percent weight gain is recorded. -The diversity of algal species is calculated for a coastal area before and after an oil spill. -Batches of seeds are soaked in salt solutions of different concentrations, and germination is counted for each batch. -An investigator hypothesizes that the adult weight of a dog is higher when it has fewer littermates.arrow_forwardGive typing answer with explanation and conclusion Which of the following would NOT be considered an ecosystem service? A. Microbes in swamps decontaminate water B. Bats and pangolins are reservoirs for COVID-19 C. Wild Hazelnut trees have genetic diversity which is not found on farms, and which can be incorporated into the cultivated population to improve disease resistance when needed D. D. Spending time in nature benefits people suffering from depressionarrow_forwardUse the data and graph below to completely and correctly answer these two questions: 5. Based on your data in Table 2 and Figure 2., how do rainfall/temperature correlate with productivity/diversity in biomes? 6. Suggest a hypothesis to explain the correlation in question 5. Label the answers and don’t use previous answers/versions. Be complete and correctarrow_forward
- In this question, why B is correct and C is wrong? Bighorn sheep are an iconic species in the western United States, however, their population size is drastically lower than it once was historically. These sheep inhabit montane patches surrounded by urban and agricultural landscapes. Accordingly, bighorn sheep can be considered a metapopulation. Wildlife managers would like to increase the patch occupancy of bighorn sheep. Which of the following would be the most effective conservation/restoration strategy? None of these statements is an effective conservation strategy. Increase patch size and quality, and decrease the distance between patches. Increase patch size and the distance between patches, and decrease patch quality. Increase the distance between patches and patchy quality, and decrease patch size. Decrease patch size, distance between patches, and patch quality.arrow_forwardIs the following statement consistent with the provided data? Answer TRUE if the statement is consistent with the data.Answer FALSE if the statement is not consistent with the data. 1. The evolution of freeze tolerance involves some factors that were not shaped directly by natural selection. 2. Because of their freeze tolerance, wood frogs may colonise more of the remainder of the island of Newfoundland than the leopard frog. 3. The distribution of the wood frog and leopard frog supports character displacement as a plausible hypothesis for why they overlap.arrow_forwardGive typing answer with explanation and conclusion Consider this claim: Changes in environmental conditions always result in new ecosystems and loss of biodiversity characterized by an increase in the number of some species, the evolution of new species, and the extinction of some species. Use what you have learned from the lesson, as well as reliable and reputable resources, to evaluate this claim. Use at least three examples from the lesson and other sources to support the valid ideas in the claim and refute the invalid?arrow_forward
- Make a graph in Excel using the data ( the image ) This data represents results from a fictional study comparing bee body weight to insecticide exposure. a. Tittleb. The graph can be any style or format but must display a relationship between the independent (x axis) and dependent (y axis) variables.c. Both axis of the graph must be correctly labeled, including correct units, andrepresent the independent and dependent variables.d. The graph must contain a trendline with a trendline equation and R2 valuearrow_forwardWrite a synthesis statement with a paragraph that follows. Hint: sampling are always below treesarrow_forwardConstruct a graph based on the informationarrow_forward
arrow_back_ios
SEE MORE QUESTIONS
arrow_forward_ios
Recommended textbooks for you
- Human Anatomy & Physiology (11th Edition)BiologyISBN:9780134580999Author:Elaine N. Marieb, Katja N. HoehnPublisher:PEARSON
 Biology 2eBiologyISBN:9781947172517Author:Matthew Douglas, Jung Choi, Mary Ann ClarkPublisher:OpenStax
 Anatomy & PhysiologyBiologyISBN:9781259398629Author:McKinley, Michael P., O'loughlin, Valerie Dean, Bidle, Theresa StouterPublisher:Mcgraw Hill Education,
  Molecular Biology of the Cell (Sixth Edition)BiologyISBN:9780815344322Author:Bruce Alberts, Alexander D. Johnson, Julian Lewis, David Morgan, Martin Raff, Keith Roberts, Peter WalterPublisher:W. W. Norton & Company
 Laboratory Manual For Human Anatomy & PhysiologyBiologyISBN:9781260159363Author:Martin, Terry R., Prentice-craver, CynthiaPublisher:McGraw-Hill Publishing Co.
 Inquiry Into Life (16th Edition)BiologyISBN:9781260231700Author:Sylvia S. Mader, Michael WindelspechtPublisher:McGraw Hill Education
Human Anatomy & Physiology (11th Edition)
Biology
ISBN:9780134580999
Author:Elaine N. Marieb, Katja N. Hoehn
Publisher:PEARSON
Biology 2e
Biology
ISBN:9781947172517
Author:Matthew Douglas, Jung Choi, Mary Ann Clark
Publisher:OpenStax
Anatomy & Physiology
Biology
ISBN:9781259398629
Author:McKinley, Michael P., O'loughlin, Valerie Dean, Bidle, Theresa Stouter
Publisher:Mcgraw Hill Education,
Molecular Biology of the Cell (Sixth Edition)
Biology
ISBN:9780815344322
Author:Bruce Alberts, Alexander D. Johnson, Julian Lewis, David Morgan, Martin Raff, Keith Roberts, Peter Walter
Publisher:W. W. Norton & Company
Laboratory Manual For Human Anatomy & Physiology
Biology
ISBN:9781260159363
Author:Martin, Terry R., Prentice-craver, Cynthia
Publisher:McGraw-Hill Publishing Co.
Inquiry Into Life (16th Edition)
Biology
ISBN:9781260231700
Author:Sylvia S. Mader, Michael Windelspecht
Publisher:McGraw Hill Education