MATLAB: An Introduction with Applications
6th Edition
ISBN: 9781119256830
Author: Amos Gilat
Publisher: John Wiley & Sons Inc
expand_more
expand_more
format_list_bulleted
Question
Use this data to help answer these questions
6. What is Negative skew associated with this study?
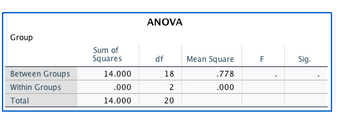
7. Ws the analysis significant and how do you know

Transcribed Image Text:Group
Grade
Valid N (listwise)
N
Descriptive Statistics
21
21
21
Minimum Maximum
1.00
3.00
12.00
99.00
Mean
2.0000
70.5714
Std.
Deviation
.83666
25.67016

Transcribed Image Text:Group
Between Groups
Within Groups
Total
Sum of
Squares
14.000
.000
14.000
ANOVA
df
18
2
20
Mean Square
.778
.000
F
Sig.
Expert Solution
arrow_forward
Step 1: Description of negative skew in the context of problem
Q-6
Since the
- mean grade = 70.5714
- maximum grade = 99
- minimum grade = 12
The negative skew associated with this study is that the distribution of grades is skewed to the left, with a majority of students receiving high grades and a smaller number of students receiving low grades.
Step by stepSolved in 3 steps

Knowledge Booster
Similar questions
- Destiny wants to know whether gender predicts depressive symptoms in patients with heart disease. She assesses the number of depressive symptoms experienced by a large sample of patients and finds that the data on depressive symptoms are positively skewed. Which assumption of a single-sample z test has Destiny most likely violated?arrow_forwardPlease help I need in an hour Thankyou so mucharrow_forwardThanks. Why is Kathy's score considered better-is it because it is a posituve score? What does the Z score represent in this case?arrow_forward
- What is the equation for the median median line?arrow_forwardExhibit 13-31 To test whether or not there is a difference between treatments A, B, C and D, a sample of 12 observations has been randomly assigned to the four treatments. You are given the results below. Treatment A B 2 C D 1.872 46.33 15.44 Observation 36 30 26 30 26 25 33 Refer to Exhibit 13-31. The mean square between treatments (MSTR) equals 20 28 28 22 34 28arrow_forwardPain medications sometimes come with side effects. One side effect is dizziness. A researcher wanted to determine if some pain medications produced more or less dizziness than others. The results from his study are shown in the table below. Use a test to determine if the proportion of people within each treatment group who experienced dizziness are the same at the � = .01 level of significance. Tordol Placebo Naproxen Tylenol Advil Dizziness 83 32 36 5 8 No dizziness 4063 1832 1330 382 337 1) Determine the null and alternative hypotheses. Select the correct pair. ��:The proportion of people within each treatment group who experienced dizziness are independent��: The proportion of people within each treatment group who experienced dizziness are dependent ��: The proportion of people within each treatment group who experienced dizziness are the same��: The proportion of people within each treatment group who experienced dizziness are different 2) Determine the…arrow_forward
- The histogram describes the height of students in a math class. Is the data univariate or bivariate? Is the skewness left, right, or normal?arrow_forwardCan I please get some help. Thank you so much!arrow_forwardHow do I interpret the 6 characteristics whith the data given? Column Mean Median Range Variance Std. dev. 1 - Cholesterol 253.92857 268 218 2276.291 47.710492arrow_forward
- What kind of analysis involves discussing the center of the data in a sample (e.g., the mean or median) and how the data is spread out? A Discrete B Descriptive Inferential D Qualitative E Continuousarrow_forwardWhat is the best description of the shape of the data below? Bell-shaped Skewed right Skewed leftarrow_forwardWhen is it better to report the median as the measure of central tendency instead of the mean? Give THREE examples.arrow_forward
arrow_back_ios
arrow_forward_ios
Recommended textbooks for you
 MATLAB: An Introduction with ApplicationsStatisticsISBN:9781119256830Author:Amos GilatPublisher:John Wiley & Sons Inc
 Probability and Statistics for Engineering and th...StatisticsISBN:9781305251809Author:Jay L. DevorePublisher:Cengage Learning
 Statistics for The Behavioral Sciences (MindTap C...StatisticsISBN:9781305504912Author:Frederick J Gravetter, Larry B. WallnauPublisher:Cengage Learning
 Elementary Statistics: Picturing the World (7th E...StatisticsISBN:9780134683416Author:Ron Larson, Betsy FarberPublisher:PEARSON
 The Basic Practice of StatisticsStatisticsISBN:9781319042578Author:David S. Moore, William I. Notz, Michael A. FlignerPublisher:W. H. Freeman
 Introduction to the Practice of StatisticsStatisticsISBN:9781319013387Author:David S. Moore, George P. McCabe, Bruce A. CraigPublisher:W. H. Freeman

MATLAB: An Introduction with Applications
Statistics
ISBN:9781119256830
Author:Amos Gilat
Publisher:John Wiley & Sons Inc

Probability and Statistics for Engineering and th...
Statistics
ISBN:9781305251809
Author:Jay L. Devore
Publisher:Cengage Learning

Statistics for The Behavioral Sciences (MindTap C...
Statistics
ISBN:9781305504912
Author:Frederick J Gravetter, Larry B. Wallnau
Publisher:Cengage Learning

Elementary Statistics: Picturing the World (7th E...
Statistics
ISBN:9780134683416
Author:Ron Larson, Betsy Farber
Publisher:PEARSON

The Basic Practice of Statistics
Statistics
ISBN:9781319042578
Author:David S. Moore, William I. Notz, Michael A. Fligner
Publisher:W. H. Freeman

Introduction to the Practice of Statistics
Statistics
ISBN:9781319013387
Author:David S. Moore, George P. McCabe, Bruce A. Craig
Publisher:W. H. Freeman