
MATLAB: An Introduction with Applications
6th Edition
ISBN: 9781119256830
Author: Amos Gilat
Publisher: John Wiley & Sons Inc
expand_more
expand_more
format_list_bulleted
Related questions
Question

Transcribed Image Text:Use
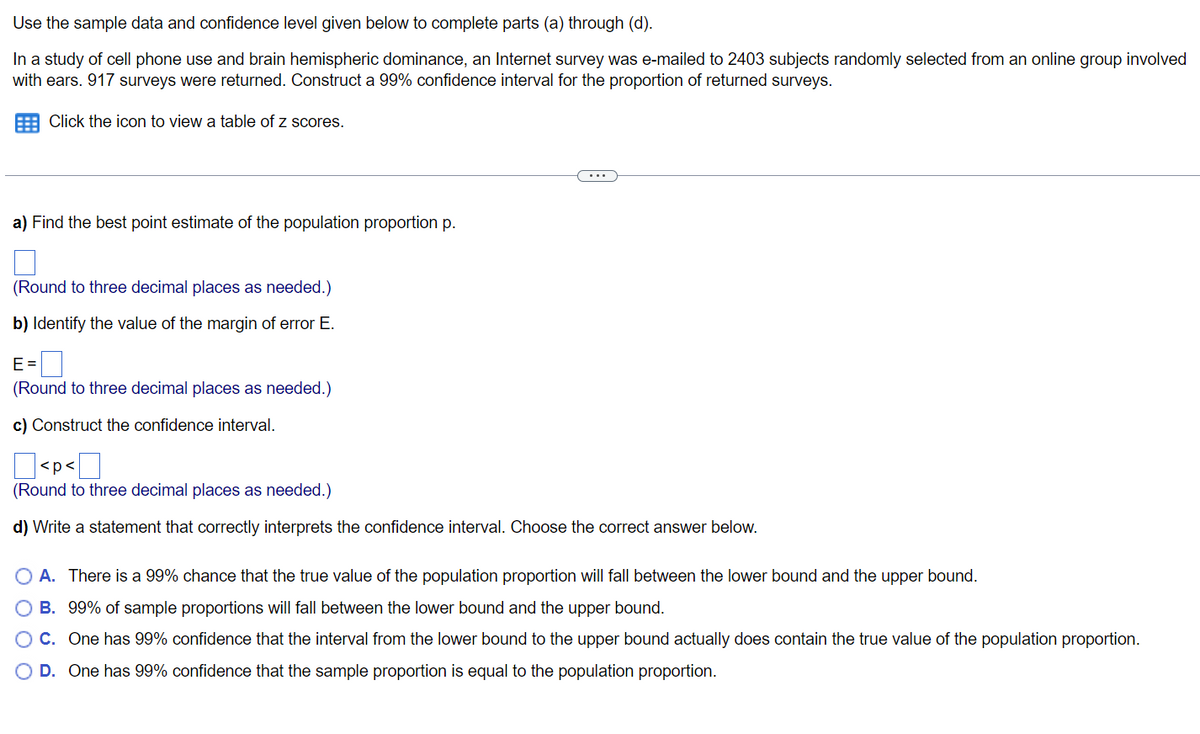
the sample data and confidence level given below to complete parts (a) through (d).
In a study of cell phone use and brain hemispheric dominance, an Internet survey was e-mailed to 2403 subjects randomly selected from an online group involved
with ears. 917 surveys were returned. Construct a 99% confidence interval for the proportion of returned surveys.
Click the icon to view a table of z scores.
a) Find the best point estimate of the population proportion p.
(Round to three decimal places as needed.)
b) Identify the value of the margin of error E.
E=
(Round to three decimal places needed.)
c) Construct the confidence interval.
<p<
0
(Round to three decimal places as needed.)
d) Write a statement that correctly interprets the confidence interval. Choose the correct answer below.
A. There is a 99% chance that the true value of the population proportion will fall between the lower bound and the upper bound.
B. 99% of sample proportions will fall between the lower bound and the upper bound.
O C. One has 99% confidence that the interval from the lower bound to the upper bound actually does contain the true value of the population proportion.
O D. One has 99% confidence that the sample proportion is equal to the population proportion.

Transcribed Image Text:Standard Normal (z) Distribution
Q
0
Z
Cumulative Area from the LEFT
.01
.02
.03
.5040
.5080
.5120
5438
.5478
.5517
.5832
.5871
.5910
.6217
.6255
.6293
.6591
.6628
.6664
.6950
.6985
.7019
.7291
.7324
.7357
.7611
.7642
.7673
.7910
.7939
.7967
.8186
.8212
.8238
.8438
.8461
.8485
.8665
.8686
.8708
.8869
.8888
.8907
.9049
.9066
.9082
.9207
.9222
.9236
.9345
.9357
.9370
.9463
.9474
.9484
9564
.9573
.9582
.9649
.9656
.9664
.9719
.9726
.9732
.9778
.9783
.9788
.9826
.9830
.9834
.9864
.9868
.9871
.9896
.9898
.9901
.9920
.9922
.9925
091
0041
0912
Z
0.0
0.1
0.2
0.3
0.4
0.5
0.6
0.7
0.8
0.9
1.0
1.1
1.2
1.3
1.4
1.5
1.6
1.7
1.8
1.9
2.0
2.1
2.2
2.3
2.4
25
.00
5000
5398
5793
.6179
.6554
.6915
.7257
.7580
.7881
.8159
.8413
.8643
.8849
.9032
.9192
.9332
9452
.9554
.9641
9713
9772
.9821
.9861
9893
.9918
0020
POSITIVE Z Scores
z
.04
.05
.06
.07
.08
5160
5199
.5239
.5279
5319
5557
5596
.5636
.5675
.5714
.5948
.5987
.6026
.6064
.6103
.6331
.6368
.6406
.6443
.6480
.6700
.6736
.6772
.6808
.6844
.7054
.7088
.7123
.7157
.7190
.7389
.7422
.7454
.7486
.7517
.7704
.7734
.7764
.7794
.7823
.7995
.8023
.8051
.8078
.8106
.8264
.8289
.8315
.8340
.8365
.8508
.8531
.8554
.8577
.8599
.8729
.8749
.8770
.8790
8810
.8925
.8944
.8962
.8980
.8997
.9099
.9115
.9131
.9147
.9162
.9251
.9265
.9279
.9292
.9306
.9382
.9394
.9406
.9418
.9429
.9495
.9505
.9515
.9525
.9535
9591
9599
.9608
.9616
9625
.9671
9678
.9686
.9693
.9699
.9738
9744
.9750
.9756
.9761
9793
9798
.9803
.9808
.9812
.9838
.9842
.9846
.9850
.9854
.9875
.9878
.9881
.9884
.9887
.9904
.9906
.9909
.9911
.9913
9927
.9929
.9931
.9932
.9934
0015
0016
0012
ООЛО
0051
.09
535
.575
.614
.651
.687
.722
.754
.785
.813
.838
.862
.883
.901
.917
.931
.944
.954
.963
.97(
.97€
.981
.985
.989
.991
.993
00
I
Expert Solution
This question has been solved!
Explore an expertly crafted, step-by-step solution for a thorough understanding of key concepts.

Step by stepSolved in 4 steps

Knowledge Booster

Similar questions
- Use the sample data and confidence level given below to complete parts (a) through (d). In a study of cell phone use and brain hemispheric dominance, an Internet survey was e-mailed to 2437 subjects randomly selected from an online group involved with ears. 1180 surveys were returned. Construct a 90% confidence interval for the proportion of returned surveys. Click the icon to view a table of z scores. a) Find the best point estimate of the population proportion p. □ (Round to three decimal places as needed.) b) Identify the value of the margin of error E. E= (Round to three decimal places as needed.) c) Construct the confidence interval. Πέρα Πarrow_forwardConstruct a 95% confidence interval for p1 - p2 for a survey that finds 30% of 240 males and 41% of 200 females are opposed to the death penalty. Group of answer choices a.(-0.200, -0.021) b.(-1.532, 1.342) c.(-1.324, 1.512) d.(-0.561, 0.651)arrow_forwardIn a study of government financial aid for college students, it becomes necessary to estimate the percentage of full-time college students who earn a bachelor's degree in four years or less. Find the sample size needed to estimate that percentage. Use a 0.05 margin of error and use a confidence level of 99%. Complete parts (a) through (c) below.arrow_forward
- Use the sample data and confidence level given below to complete parts (a) through (d). In a study of cell phone use and brain hemispheric dominance, an Internet survey was e-mailed to 2486 subjects randomly selected from an online group involved with ears. 944 surveys were returned. Construct a 90% confidence interval for the proportion of returned surveys. E Click the icon to view a table of z scores. a) Find the best point estimate of the population proportion p. (Round to three decimal places as needed.) b) Identify the value of the margin of error E. E=D (Round to three decimal places as needed.) c) Construct the confidence interval. Oarrow_forwardUse the sample data and confidence level given below to complete parts (a) through (d). In a study of cell phone use and brain hemispheric dominance, an Internet survey was e-mailed to 2335 subjects randomly selected from an online group involved with ears. 924 surveys were returned. Construct a 99% confidence interval for the proportion of returned surveys. E Click the icon to view a table of z scores. a) Find the best point estimate of the population proportion p. (Round to three decimal places as needed.) b) Identify the value of the margin of error E. E=L (Round to three decimal places as needed.) c) Construct the confidence interval. (Round to three decimal places as needed.) d) Write a statement that correctly interprets the confidence interval. Choose the correct answer below. O A. One has 99% confidence that the interval from the lower bound to the upper bound actually does contain the true value of the population proportion. O B. One has 99% confidence that the sample…arrow_forwardUse the sample data and confidence level given below to complete parts (a) through (d). In a study of cell phone use and brain hemispheric dominance, an Internet survey was e-mailed to 2460 subjects randomly selected from an online group involved with ears. 1005 surveys were returned. Construct a 95% confidence interval for the proportion of returned surveys. Click the icon to view a table of z scores. a) Find the best point estimate of the population proportion p. (Round to three decimal places as needed.)arrow_forward
- Use the sample data and confidence level given below to complete parts (a) through (d). In a study of cell phone use and brain hemispheric dominance, an Internet survey was e-mailed to 2440 subjects randomly selected from an online group involved with ears. 1077 surveys were returned. Construct a 99% confidence interval for the proportion of returned surveys. Click the icon to view a table of z scores. a) Find the best point estimate of the population proportion p. (Round to three decimal places as needed.) b) Identify the value of the margin of error E. E = (Round to three decimal places as needed.) c) Construct the confidence interval.arrow_forwardUse the sample data and confidence level given below to complete parts (a) through (d). In a study of cell phone use and brain hemispheric dominance, an Internet survey was e-mailed to 2540 subjects randomly selected from an online group involved with ears. 1141 surveys were returned. Construct a 90% confidence interval for the proportion of returned surveys. Click the icon to view a table of z scores. a) Find the best point estimate of the population proportion p. (Round to three decimal places as needed.) b) Identify the value of the margin of error E. E= (Round to three decimal places as needed.) c) Construct the confidence interval.arrow_forwardUse the sample data and confidence level given below to complete parts (a) through (d). In a study of cell phone use and brain hemispheric dominance, an Internet survey was e-mailed to 2642 subjects randomly selected from an online group involved with ears. 1128 surveys were returned. Construct a 99% confidence interval for the proportion of returned surveys. Click the icon to view a table of z scores. a) Find the best point estimate of the population proportion p. (Round to three decimal places as needed.) b) Identify the value of the margin of error E. E = (Round to three decimal places as needed.) c) Construct the confidence interval.arrow_forward
- Use the sample data and confidence level given below to complete parts (a) through (d). In a study of cell phone use and brain hemispheric dominance, an Internet survey was e-mailed to 2423 subjects randomly selected from an online group involved with ears. 923 surveys were returned. Construct a 99% confidence interval for the proportion of returned surveys. Click the icon to view a table of z scores. a) Find the best point estimate of the population proportion p. (Round to three decimal places as needed.) b) Identify the value of the margin of error E. E = (Round to three decimal places as needed.) c) Construct the confidence interval. ]arrow_forwardAn online retailer has identified the maximum willingness of 10 consumers to pay for the same product. The 10 prices are: $10.00, $11.50, $9.50, $10.20, $11.20, $10.50, $9.80, $10.10, $9.90, $11.00 The retailer seeks a 95% confidence interval for the mean price consumers are willing to pay. The sample mean is calculated as $10.37, and the sample standard deviation is $0.66. Also consider the following t-values: Degrees of freedom 8 a. (9.99, 10.75) 9 10 90% confidence 1.86 1.833 1.812 95% confidence 2.306 2.262 2.228 99% confidence 3.355 3.250 3.169 Selecting the correct t-value, calculate the limits of the confidence interval.arrow_forward
arrow_back_ios
arrow_forward_ios
Recommended textbooks for you
- MATLAB: An Introduction with ApplicationsStatisticsISBN:9781119256830Author:Amos GilatPublisher:John Wiley & Sons Inc
 Probability and Statistics for Engineering and th...StatisticsISBN:9781305251809Author:Jay L. DevorePublisher:Cengage Learning
 Statistics for The Behavioral Sciences (MindTap C...StatisticsISBN:9781305504912Author:Frederick J Gravetter, Larry B. WallnauPublisher:Cengage Learning
  Elementary Statistics: Picturing the World (7th E...StatisticsISBN:9780134683416Author:Ron Larson, Betsy FarberPublisher:PEARSON
 The Basic Practice of StatisticsStatisticsISBN:9781319042578Author:David S. Moore, William I. Notz, Michael A. FlignerPublisher:W. H. Freeman
 Introduction to the Practice of StatisticsStatisticsISBN:9781319013387Author:David S. Moore, George P. McCabe, Bruce A. CraigPublisher:W. H. Freeman
MATLAB: An Introduction with Applications
Statistics
ISBN:9781119256830
Author:Amos Gilat
Publisher:John Wiley & Sons Inc
Probability and Statistics for Engineering and th...
Statistics
ISBN:9781305251809
Author:Jay L. Devore
Publisher:Cengage Learning
Statistics for The Behavioral Sciences (MindTap C...
Statistics
ISBN:9781305504912
Author:Frederick J Gravetter, Larry B. Wallnau
Publisher:Cengage Learning
Elementary Statistics: Picturing the World (7th E...
Statistics
ISBN:9780134683416
Author:Ron Larson, Betsy Farber
Publisher:PEARSON
The Basic Practice of Statistics
Statistics
ISBN:9781319042578
Author:David S. Moore, William I. Notz, Michael A. Fligner
Publisher:W. H. Freeman
Introduction to the Practice of Statistics
Statistics
ISBN:9781319013387
Author:David S. Moore, George P. McCabe, Bruce A. Craig
Publisher:W. H. Freeman