
MATLAB: An Introduction with Applications
6th Edition
ISBN: 9781119256830
Author: Amos Gilat
Publisher: John Wiley & Sons Inc
expand_more
expand_more
format_list_bulleted
Related questions
Question
thumb_up100%
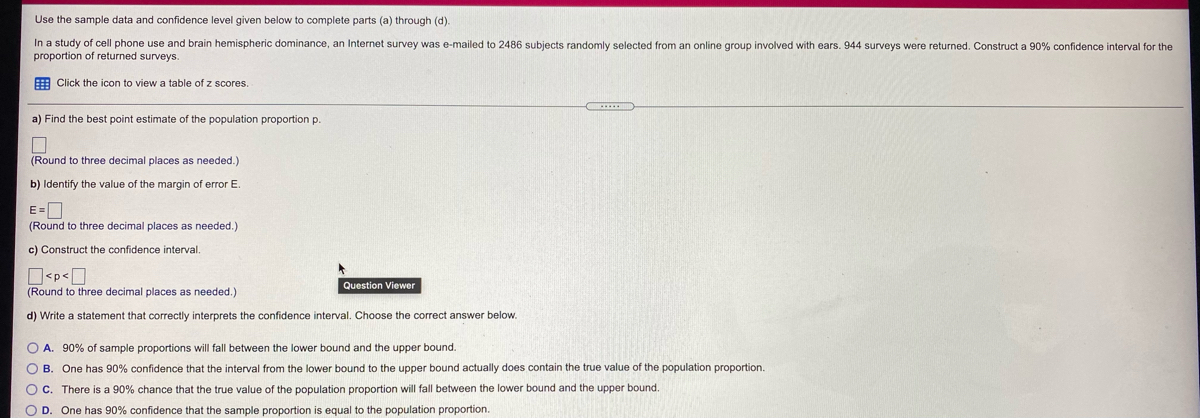

Transcribed Image Text:Use the sample data and confidence level given below to complete parts (a) through (d).
In a study of cell phone use and brain hemispheric dominance, an Internet survey was e-mailed to 2486 subjects randomly selected from an online group involved with ears. 944 surveys were returned. Construct a 90% confidence interval for the
proportion of returned surveys.
E Click the icon to view a table of z scores.
a) Find the best point estimate of the population proportion p.
(Round to three decimal places as needed.)
b) Identify the value of the margin of error E.
E=D
(Round to three decimal places as needed.)
c) Construct the confidence interval.
O<p<O
(Round to three decimal places as needed.)
Question Viewer
d) Write a statement that correctly interprets the confidence interval. Choose the correct answer below.
O A. 90% of sample proportions will fall between the lower bound and the upper bound.
O B. One has 90% confidence that the interval from the lower bound to the upper bound actually does contain the true value of the population proportion.
OC. There is a 90% chance that the true value of the population proportion will fall between the lower bound and the upper bound.
O D. One has 90% confidence that the sample proportion is equal to the population proportion.
Expert Solution
This question has been solved!
Explore an expertly crafted, step-by-step solution for a thorough understanding of key concepts.

Step by stepSolved in 2 steps with 1 images

Knowledge Booster

Similar questions
- Use the sample data and confidence level given below to complete parts (a) through (d). In a study of cell phone use and brain hemispheric dominance, an Internet survey was e-mailed to 2543 subjects randomly selected from an online group involved with ears. 1055 surveys were returned. Construct a 99% confidence interval for the proportion of returned surveys. Click the icon to view a table of z scores. a) Find the best point estimate of the population proportion p. (Round to three decimal places as needed.) b) Identify the value of the margin of error E. E = (Round to three decimal places as needed.) c) Construct the confidence interval. Oarrow_forwardUse the sample data and confidence level given below to complete parts (a) through (d). In a study of cell phone use and brain hemispheric dominance, an Internet survey was e-mailed to 2610 subjects randomly selected from an online group involved with ears. 1052 surveys were returned. Construct a 95% confidence interval for the proportion of returned surveys. Click the icon to view a table of z scores. a) Find the best point estimate of the population proportion p. (Round to three decimal places as needed.) b) Identify the value of the margin of error E. E = (Round to three decimal places as needed.) c) Construct the confidence interval.arrow_forwardUse the sample data and confidence level given below to complete parts (a) through (d). In a study of cell phone use and brain hemispheric dominance, an Internet survey was e-mailed to 2437 subjects randomly selected from an online group involved with ears. 1180 surveys were returned. Construct a 90% confidence interval for the proportion of returned surveys. Click the icon to view a table of z scores. a) Find the best point estimate of the population proportion p. □ (Round to three decimal places as needed.) b) Identify the value of the margin of error E. E= (Round to three decimal places as needed.) c) Construct the confidence interval. Πέρα Πarrow_forward
- Use the sample data and confidence level given below to complete parts (a) through (d). In a study of cell phone use and brain hemispheric dominance, an Internet survey was e-mailed to 2335 subjects randomly selected from an online group involved with ears. 924 surveys were returned. Construct a 99% confidence interval for the proportion of returned surveys. E Click the icon to view a table of z scores. a) Find the best point estimate of the population proportion p. (Round to three decimal places as needed.) b) Identify the value of the margin of error E. E=L (Round to three decimal places as needed.) c) Construct the confidence interval. (Round to three decimal places as needed.) d) Write a statement that correctly interprets the confidence interval. Choose the correct answer below. O A. One has 99% confidence that the interval from the lower bound to the upper bound actually does contain the true value of the population proportion. O B. One has 99% confidence that the sample…arrow_forwardUse the sample data and confidence level given below to complete parts (a) through (d). In a study of cell phone use and brain hemispheric dominance, an Internet survey was e-mailed to 2460 subjects randomly selected from an online group involved with ears. 1005 surveys were returned. Construct a 95% confidence interval for the proportion of returned surveys. Click the icon to view a table of z scores. a) Find the best point estimate of the population proportion p. (Round to three decimal places as needed.)arrow_forwardUse the sample data and confidence level given below to complete parts (a) through (d). In a study of cell phone use and brain hemispheric dominance, an Internet survey was e-mailed to 2440 subjects randomly selected from an online group involved with ears. 1077 surveys were returned. Construct a 99% confidence interval for the proportion of returned surveys. Click the icon to view a table of z scores. a) Find the best point estimate of the population proportion p. (Round to three decimal places as needed.) b) Identify the value of the margin of error E. E = (Round to three decimal places as needed.) c) Construct the confidence interval.arrow_forward
- Use the sample data and confidence level given below to complete parts (a) through (d). In a study of cell phone use and brain hemispheric dominance, an Internet survey was e-mailed to 2540 subjects randomly selected from an online group involved with ears. 1141 surveys were returned. Construct a 90% confidence interval for the proportion of returned surveys. Click the icon to view a table of z scores. a) Find the best point estimate of the population proportion p. (Round to three decimal places as needed.) b) Identify the value of the margin of error E. E= (Round to three decimal places as needed.) c) Construct the confidence interval.arrow_forwardUse the sample data and confidence level given below to complete parts (a) through (d). In a study of cell phone use and brain hemispheric dominance, an Internet survey was e-mailed to 2642 subjects randomly selected from an online group involved with ears. 1128 surveys were returned. Construct a 99% confidence interval for the proportion of returned surveys. Click the icon to view a table of z scores. a) Find the best point estimate of the population proportion p. (Round to three decimal places as needed.) b) Identify the value of the margin of error E. E = (Round to three decimal places as needed.) c) Construct the confidence interval.arrow_forwardUse the sample data and confidence level given below to complete parts (a) through (d). In a study of cell phone use and brain hemispheric dominance, an Internet survey was e-mailed to 2423 subjects randomly selected from an online group involved with ears. 923 surveys were returned. Construct a 99% confidence interval for the proportion of returned surveys. Click the icon to view a table of z scores. a) Find the best point estimate of the population proportion p. (Round to three decimal places as needed.) b) Identify the value of the margin of error E. E = (Round to three decimal places as needed.) c) Construct the confidence interval. ]arrow_forward
arrow_back_ios
arrow_forward_ios
Recommended textbooks for you
- MATLAB: An Introduction with ApplicationsStatisticsISBN:9781119256830Author:Amos GilatPublisher:John Wiley & Sons Inc
 Probability and Statistics for Engineering and th...StatisticsISBN:9781305251809Author:Jay L. DevorePublisher:Cengage Learning
 Statistics for The Behavioral Sciences (MindTap C...StatisticsISBN:9781305504912Author:Frederick J Gravetter, Larry B. WallnauPublisher:Cengage Learning
  Elementary Statistics: Picturing the World (7th E...StatisticsISBN:9780134683416Author:Ron Larson, Betsy FarberPublisher:PEARSON
 The Basic Practice of StatisticsStatisticsISBN:9781319042578Author:David S. Moore, William I. Notz, Michael A. FlignerPublisher:W. H. Freeman
 Introduction to the Practice of StatisticsStatisticsISBN:9781319013387Author:David S. Moore, George P. McCabe, Bruce A. CraigPublisher:W. H. Freeman
MATLAB: An Introduction with Applications
Statistics
ISBN:9781119256830
Author:Amos Gilat
Publisher:John Wiley & Sons Inc
Probability and Statistics for Engineering and th...
Statistics
ISBN:9781305251809
Author:Jay L. Devore
Publisher:Cengage Learning
Statistics for The Behavioral Sciences (MindTap C...
Statistics
ISBN:9781305504912
Author:Frederick J Gravetter, Larry B. Wallnau
Publisher:Cengage Learning
Elementary Statistics: Picturing the World (7th E...
Statistics
ISBN:9780134683416
Author:Ron Larson, Betsy Farber
Publisher:PEARSON
The Basic Practice of Statistics
Statistics
ISBN:9781319042578
Author:David S. Moore, William I. Notz, Michael A. Fligner
Publisher:W. H. Freeman
Introduction to the Practice of Statistics
Statistics
ISBN:9781319013387
Author:David S. Moore, George P. McCabe, Bruce A. Craig
Publisher:W. H. Freeman