Essentials Of Investments
11th Edition
ISBN: 9781260013924
Author: Bodie, Zvi, Kane, Alex, MARCUS, Alan J.
Publisher: Mcgraw-hill Education,
expand_more
expand_more
format_list_bulleted
Concept explainers
Topic Video
Question

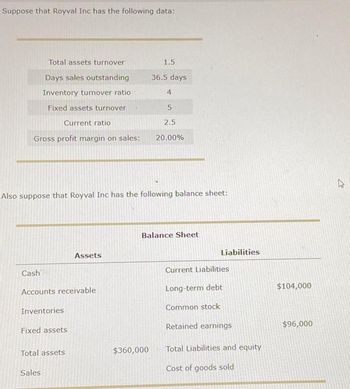
Transcribed Image Text:Suppose that Royval Inc has the following data:
Total assets turnover
Days sales outstanding
Inventory turnover ratio
Fixed assets turnover
Current ratio
Gross profit margin on sales:
Cash
Also suppose that Royval Inc has the following balance sheet:
Accounts receivable
Inventories
Fixed assets
Total assets
Assets
Sales
1.5
36.5 days
4
$360,000
5
2.5
20.00%
Balance Sheet
Liabilities
Current Liabilities
Long-term debt
Common stock
Retained earnings
Total Liabilities and equity
Cost of goods sold
$104,000
$96,000

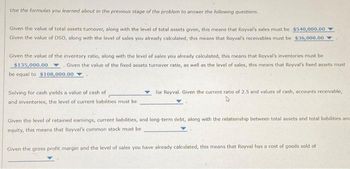
Transcribed Image Text:Use the formulas you learned about in the previous stage of the problem to answer the following questions.
Given the value of total assets turnover, along with the level of total assets given, this means that Royval's sales must be $540,000.00
Given the value of DSO, along with the level of sales you already calculated, this means that Royval's receivables must be $36,000.00
Given the value of the inventory ratio, along with the level of sales you already calculated, this means that Royval's inventores must be
$135,000.00. Given the value of the fixed assets turnover ratio, as well as the level of sales, this means that Royval's fixed assets must
be equal to $108,000.00
Solving for cash yields a value of cash of
and inventories, the level of current liabilities must be
for Royval. Given the current ratio of 2.5 and values of cash, accounts receivable,
Given the level of retained earnings, current liabilities, and long-term debt, along with the relationship between total assets and total liabilities and
equity, this means that Royval's common stock must be
Given the gross profit margin and the level of sales you have already calculated, this means that Royval has a cost of goods sold of
Expert Solution
This question has been solved!
Explore an expertly crafted, step-by-step solution for a thorough understanding of key concepts.
This is a popular solution
Trending nowThis is a popular solution!
Step by stepSolved in 7 steps

Knowledge Booster
Learn more about
Need a deep-dive on the concept behind this application? Look no further. Learn more about this topic, finance and related others by exploring similar questions and additional content below.Similar questions
- Identify the activity ratio of a computer shop is its Cost of Goods Sold is P12 million and the Average Inventory is P24 million. Analyze and interpret your answer. Compute the return on investment of AR Grocery Store if the net profit after taxes is P10 million and its total assets is P100 million. Analyze and interpret your answer.arrow_forwardThe AFN equation and the financial statement–forecasting approach both assume that assets grow at relatively the same rate as sales. However, the relationship between assets and sales is often a little more difficult than that. In particular, some firms use regression analysis to predict the required assets needed to support a given level of sales. General Services Corp. has used its historical sales and asset data to estimate the following regression equations: Accounts Receivable = –$85,230 + 0.265(Sales) Inventories = $9,110 + 0.211(Sales) General Services Corp. currently has sales of $922,000, but it expects sales to grow by 20% over the next year. Use the regression models to calculate General Services Corp.’s forecasted values for accounts receivable and inventories needed to support next year’s sales. Forecasted Values for Next Year Accounts receivable Inventories Based on the next year’s accounts receivable and inventory…arrow_forwardSmith Corporation had Sales of $2,350,000 in 2021 and $2,125,000 in 2020. Cost of Good Sold were $1,400,000 in 2021 and $1,325,000 in 2020. a. What was the percentage change in Sales year to year? b. What was the percentage change in Cost of Goods Sold year to year? c. Relative to the percentage in Sales, would you say the percentage change on Cost of Goods Sold was favorable or unfavorable? d. Is this an example of horizontal or vertical analysis?arrow_forward
- Another way to look at the concept of inventory turnover is by measuring sales per square foot. Taking the average inventory at retail and dividing it by the number of square feet devoted to a particular product will give you average sales per square foot. When you multiply this figure by the inventory turnover rate, you get the annual sales per square foot. It is important to know the amount of sales per square foot your merchandise is producing, both on average and annually. These figures should be tracked monthly and compared with industry standards for businesses of similar size and type. You own a large multi product electronics store in a regional mall. The store has 10,200 square feet of selling space divided into five departments. (a) From the table below, calculate the average and annual sales (in $) per square foot. Then calculate the annual sales (in $) for each department and the total sales (in $) for the entire store. (Round your average and annual sales per square…arrow_forwardConsider the streams of income given in the following table: a. Find the present value of each income stream, using a discount rate of 4%, then repeat those calculations using a discount rate of 8%. b. Compare the calculated present values and discuss them in light of the fact that the undiscounted total income amounts to $14,000 in each case. a. The present value of income stream A. using a discount rate of 4% is §. (Round to the nearest cent) Data table Income Stream End of Year A $5,000 $4,000 $3,000 $2,000 $2,000 $3,000 1 $4,000 4 $5,000 Total $14,000 $14,000 (Click on the icon located on the top-right corner of the data table below in order to copy its contents into a spreadsheet.) Clear all Check answer Help rarrow_forwardPlease see image to solve question.arrow_forward
- Sub : FinancePls answer very fast.I ll upvote CORRECT ANSWER . Thank You ( dnt use CHATGPT)arrow_forwardUse the "percent of sales method" of preparing pro forma financial statements to determine the projection for next year's accounts receivable. Make the following assumptions: current year's sales are $55,750,000; current year's cost of goods sold is $25,350,000; sales are expected to rise by 25%, The firm's investment in accounts receivable in the current year is $12,600,000. The firm's marginal tax rate is 35%. What is the projection for next year's accounts receivable? $10,320,000 $11,345,000 O $15,750,000 $8,772,000arrow_forwardNonearrow_forward
- Judging only from the ratios given, which of the following clothing wholesalers is least likely to have cash flow problems? Multiple Choice Company A, who has a receivables turnover of 5, and an inventory turnover of 2 Company B, who has a receivables turnover of 2, and an inventory turnover of 5 Company C, who has a receivables turnover of 10, and an inventory turnover of 10 Company D, who has a receivables turnover of 1, and an inventory turnover of 1 < Prev. Next Jm 48 of 50arrow_forwardFor 2021, Walmart and Target had the following information (all values are in millions of dollars): Assume a 365-day year. a. What is each company's accounts receivable days? b. What is each company's inventory turnover? c. Which company is managing its accounts receivable and inventory more efficiently? Data table (Click on the following icon in order to copy its contents into a spreadsheet.) Walmart Target (Income Statement) Sales 572,762 106,007 Cost of Goods Sold (Income Statement) 428,997 74,962 Accounts Receivable (Balance Sheet) 8,279 830 Inventory (Balance She 56,519 13,902 = Xarrow_forwardAnother way to look at the concept of inventory turnover is by measuring sales per square foot. Taking the average inventory at retail and dividing it by the number of square feet devoted to a particular product will give you average sales per square foot. When you multiply this figure by the inventory turnover rate, you get the annual sales per square foot. It is important to know the amount of sales per square foot your merchandise is producing, both on average and annually. These figures should be tracked monthly and compared with industry standards for businesses of similar size and type. You own a large multi product electronics store in a regional mall. The store has 10,600 square feet of selling space divided into five departments. (a) From the table below, calculate the average and annual sales (in $) per square foot. Then calculate the annual sales (in $) for each department and the total sales (in $) for the entire store. (Round your average and annual sales per square foot…arrow_forward
arrow_back_ios
SEE MORE QUESTIONS
arrow_forward_ios
Recommended textbooks for you
 Essentials Of InvestmentsFinanceISBN:9781260013924Author:Bodie, Zvi, Kane, Alex, MARCUS, Alan J.Publisher:Mcgraw-hill Education,

 Foundations Of FinanceFinanceISBN:9780134897264Author:KEOWN, Arthur J., Martin, John D., PETTY, J. WilliamPublisher:Pearson,
 Fundamentals of Financial Management (MindTap Cou...FinanceISBN:9781337395250Author:Eugene F. Brigham, Joel F. HoustonPublisher:Cengage Learning
 Corporate Finance (The Mcgraw-hill/Irwin Series i...FinanceISBN:9780077861759Author:Stephen A. Ross Franco Modigliani Professor of Financial Economics Professor, Randolph W Westerfield Robert R. Dockson Deans Chair in Bus. Admin., Jeffrey Jaffe, Bradford D Jordan ProfessorPublisher:McGraw-Hill Education

Essentials Of Investments
Finance
ISBN:9781260013924
Author:Bodie, Zvi, Kane, Alex, MARCUS, Alan J.
Publisher:Mcgraw-hill Education,


Foundations Of Finance
Finance
ISBN:9780134897264
Author:KEOWN, Arthur J., Martin, John D., PETTY, J. William
Publisher:Pearson,

Fundamentals of Financial Management (MindTap Cou...
Finance
ISBN:9781337395250
Author:Eugene F. Brigham, Joel F. Houston
Publisher:Cengage Learning

Corporate Finance (The Mcgraw-hill/Irwin Series i...
Finance
ISBN:9780077861759
Author:Stephen A. Ross Franco Modigliani Professor of Financial Economics Professor, Randolph W Westerfield Robert R. Dockson Deans Chair in Bus. Admin., Jeffrey Jaffe, Bradford D Jordan Professor
Publisher:McGraw-Hill Education