
Essentials Of Investments
11th Edition
ISBN: 9781260013924
Author: Bodie, Zvi, Kane, Alex, MARCUS, Alan J.
Publisher: Mcgraw-hill Education,
expand_more
expand_more
format_list_bulleted
Related questions
Concept explainers
Topic Video
Question
Concepts of Risk. In broad terms, why is some risk diversifiable? Why are some risks non-diversifiable? Does it follow that an investor can control the level of unsystematic risk in a portfolio, but not the level of systematic risk?
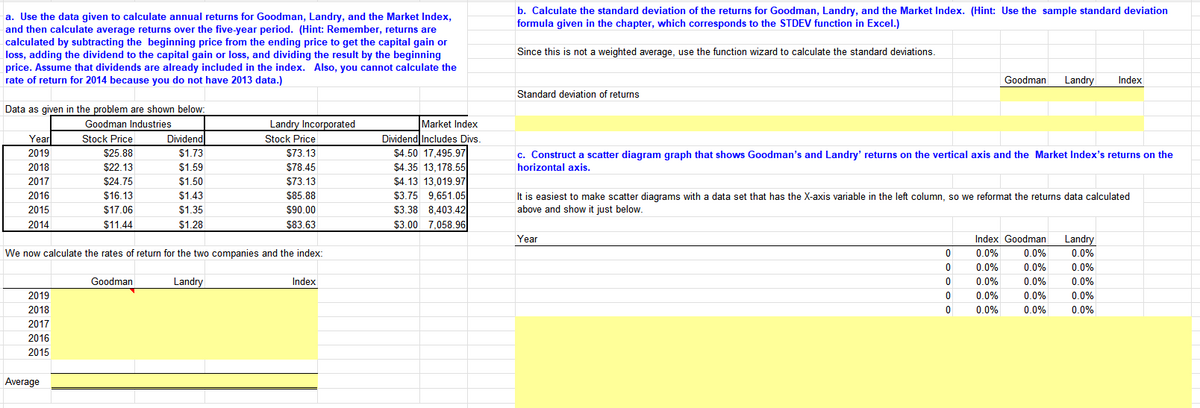

Transcribed Image Text:a. Use the data given to calculate annual returns for Goodman, Landry, and the Market Index,
and then calculate average returns over the five-year period. (Hint: Remember, returns are
calculated by subtracting the beginning price from the ending price to get the capital gain or
loss, adding the dividend to the capital gain or loss, and dividing the result by the beginning
price. Assume that dividends are already included in the index. Also, you cannot calculate the
rate of return for 2014 because you do not have 2013 data.)
Data as given in the problem are shown below:
Goodman Industries
Year
2019
2018
2017
2016
2015
2014
2019
2018
2017
2016
2015
Stock Price
$25.88
$22.13
$24.75
Average
$16.13
$17.06
$11.44
We now calculate the rates of return for the two companies and the index:
Dividend
$1.73
$1.59
$1.50
$1.43
$1.35
$1.28
Goodman
Landry Incorporated
Stock Price
$73.13
$78.45
$73.13
$85.88
$90.00
$83.63
Landry
Index
Market Index
Dividend Includes Divs.
$4.50 17,495.97
$4.35 13,178.55
$4.13 13,019.97
$3.75 9,651.05
$3.38 8,403.42
$3.00 7,058.96
b. Calculate the standard deviation of the returns for Goodman, Landry, and the Market Index. (Hint: Use the sample standard deviation
formula given in the chapter, which corresponds to the STDEV function in Excel.)
Since this is not a weighted average, use the function wizard to calculate the standard deviations.
Standard deviation of returns
c. Construct a scatter diagram graph that shows Goodman's and Landry' returns on the vertical axis and the Market Index's returns on the
horizontal axis.
Goodman Landry Index
It is easiest to make scatter diagrams with a data set that has the X-axis variable in the left column, so we reformat the returns data calculated
above and show it just below.
Year
0
0
0
0
0
Index Goodman
0.0%
0.0%
0.0%
0.0%
0.0%
0.0%
0.0%
0.0%
0.0%
0.0%
Landry
0.0%
0.0%
0.0%
0.0%
0.0%
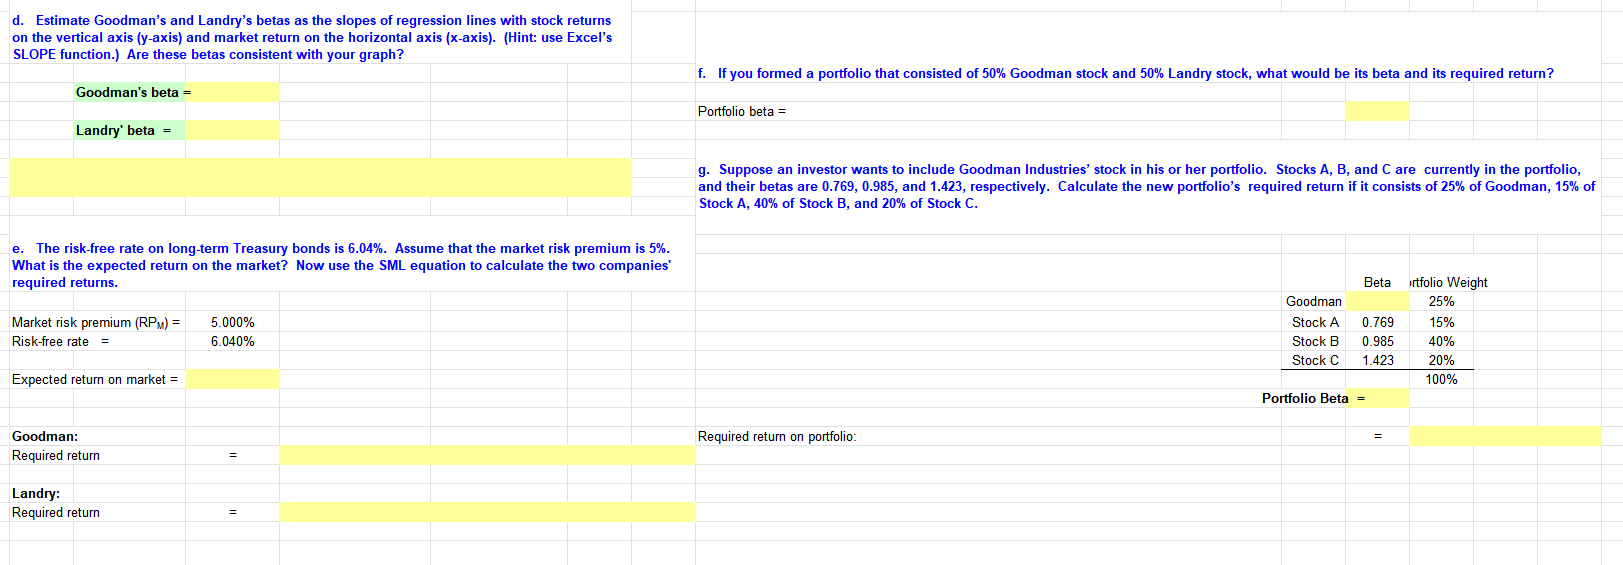
Transcribed Image Text:d. Estimate Goodman's and Landry's betas as the slopes of regression lines with stock returns
on the vertical axis (y-axis) and market return on the horizontal axis (x-axis). (Hint: use Excel's
SLOPE function.) Are these betas consistent with your graph?
Goodman's beta =
Landry' beta =
e. The risk-free rate on long-term Treasury bonds is 6.04%. Assume that the market risk premium is 5%.
What is the expected return on the market? Now use the SML equation to calculate the two companies'
required returns.
Market risk premium (RPM) =
Risk-free rate =
Expected return on market =
Goodman:
Required return
Landry:
Required return
5.000%
6.040%
=
=
f. If you formed a portfolio that consisted of 50% Goodman stock and 50% Landry stock, what would be its beta and its required return?
Portfolio beta =
g. Suppose an investor wants to include Goodman Industries' stock in his or her portfolio. Stocks A, B, and C are currently in the portfolio,
and their betas are 0.769, 0.985, and 1.423, respectively. Calculate the new portfolio's required return if it consists of 25% of Goodman, 15% of
Stock A, 40% of Stock B, and 20% of Stock C.
Required return on portfolio:
Goodman
Stock A
Stock B
Stock C
Beta rtfolio Weight
25%
15%
40%
20%
100%
0.769
0.985
1.423
Portfolio Beta =
=
Expert Solution
This question has been solved!
Explore an expertly crafted, step-by-step solution for a thorough understanding of key concepts.

This is a popular solution

Trending nowThis is a popular solution!

Step by stepSolved in 4 steps with 4 images

Knowledge Booster


Learn more about
Need a deep-dive on the concept behind this application? Look no further. Learn more about this topic, finance and related others by exploring similar questions and additional content below.Similar questions
- 2. Stock prices and stand-alone risk Risk is the potential for an investment to generate more than one return. A security that will produce only one known return is referred to as a risk-free asset, as there is no potential for deviation from the known expected outcome. Investments that have the chance of producing more than one possible outcome are called risky assets. Risk, or potential variability in an investment's possible returns, occurs when there is uncertainty about an investment's future outcome, such as the return expected to be generated by the investment and realized by an investor. Generally, investors would prefer to invest in assets that have: O A higher-than-average expected rate of return given the perceived risk O A lower-than-average expected rate of return given the perceived risk Read the following descriptions and identify the type of risk or term being described: Description This type of risk relates to the possibility that a firm will not be able to service its…arrow_forwardThe systematic risk principle states that the expected return on a risky asset depends only on which one of the following? Unsystematic risk Market risk Diversifiable riskarrow_forwardRisks that are insurable because their probabilities can be calculated precisely enough for the risk to be quantified. a) Speculative b) Explicit c) Measured d) Purearrow_forward
- How can an investor eliminate Systematic risk?arrow_forwardDerivatives are used in risk management because they _____.a. diversify risksb. hedge risksc. avoid risksd. none of the abovearrow_forwardPlease select the risk that affect only a single company? market risks. specific risks. systematic risks. risk premiums.arrow_forward
- What type of risk is the risk that belongs to the market as a whole? Systematic risk Unsystematic risk (or nonsystematic risk) Total riskarrow_forwardWhich one of the following statements is correct concerning unsystematic risk? An investor is rewarded for assuming unsystematic risk. Beta measures the level of unsystematic risk inherent in an individual security. Eliminating unsystematic risk is the responsibility of the individual investor. Standard deviation is a measure of unsystematic risk. Unsystematic risk is rewarded when it exceeds the market level of unsystematic risk. оо O Oarrow_forwardWhy are investors risk-averse? How can investors deal with different degrees of risk?arrow_forward
- Explain the concept of risk - return trade-off in investing. How do investors balance risk and return. when making investment decisions?arrow_forwardSystematic risk is diversifiable, so it is an investment's relevant risk. Unsystematic risk is O True Falsearrow_forwardPortfolio expected return and risk A collection of financial assets and securities is referred to as a portfolio. Most individuals and institutions invest in a portfolio, making portfolio risk analysis an integral part of the field of finance. Just like stand-alone assets and securities, portfolios are also exposed to risk. Portfolio risk refers to the possibility that an investment portfolio will not generate the investor’s expected rate of return. Analyzing portfolio risk and return involves the understanding of expected returns from a portfolio. Consider the following case: Andre is an amateur investor who holds a small portfolio consisting of only four stocks. The stock holdings in his portfolio are shown in the following table: Stock Percentage of Portfolio Expected Return Standard Deviation Artemis Inc. 20% 6.00% 31.00% Babish & Co. 30% 14.00% 35.00% Cornell Industries 35% 11.00% 38.00% Danforth Motors 15% 3.00% 40.00% What is the expected…arrow_forward
arrow_back_ios
SEE MORE QUESTIONS
arrow_forward_ios
Recommended textbooks for you
- Essentials Of InvestmentsFinanceISBN:9781260013924Author:Bodie, Zvi, Kane, Alex, MARCUS, Alan J.Publisher:Mcgraw-hill Education,


 Foundations Of FinanceFinanceISBN:9780134897264Author:KEOWN, Arthur J., Martin, John D., PETTY, J. WilliamPublisher:Pearson,
 Fundamentals of Financial Management (MindTap Cou...FinanceISBN:9781337395250Author:Eugene F. Brigham, Joel F. HoustonPublisher:Cengage Learning
 Corporate Finance (The Mcgraw-hill/Irwin Series i...FinanceISBN:9780077861759Author:Stephen A. Ross Franco Modigliani Professor of Financial Economics Professor, Randolph W Westerfield Robert R. Dockson Deans Chair in Bus. Admin., Jeffrey Jaffe, Bradford D Jordan ProfessorPublisher:McGraw-Hill Education
Essentials Of Investments
Finance
ISBN:9781260013924
Author:Bodie, Zvi, Kane, Alex, MARCUS, Alan J.
Publisher:Mcgraw-hill Education,
Foundations Of Finance
Finance
ISBN:9780134897264
Author:KEOWN, Arthur J., Martin, John D., PETTY, J. William
Publisher:Pearson,
Fundamentals of Financial Management (MindTap Cou...
Finance
ISBN:9781337395250
Author:Eugene F. Brigham, Joel F. Houston
Publisher:Cengage Learning
Corporate Finance (The Mcgraw-hill/Irwin Series i...
Finance
ISBN:9780077861759
Author:Stephen A. Ross Franco Modigliani Professor of Financial Economics Professor, Randolph W Westerfield Robert R. Dockson Deans Chair in Bus. Admin., Jeffrey Jaffe, Bradford D Jordan Professor
Publisher:McGraw-Hill Education