MATLAB: An Introduction with Applications
6th Edition
ISBN: 9781119256830
Author: Amos Gilat
Publisher: John Wiley & Sons Inc
expand_more
expand_more
format_list_bulleted
Question

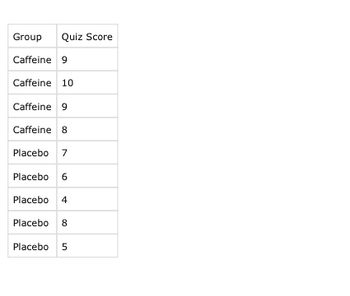
Transcribed Image Text:Group Quiz Score
Caffeine 9
Caffeine 10
Caffeine 9
Caffeine 8
Placebo 7
Placebo 6
Placebo 4
Placebo 8
Placebo 5

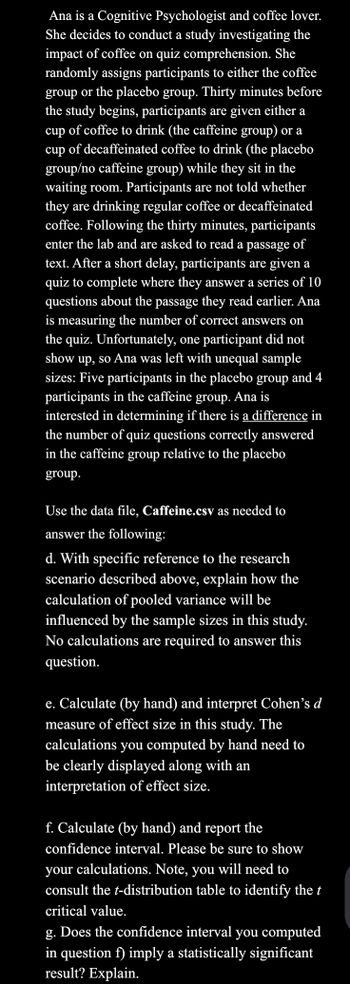
Transcribed Image Text:Ana is a Cognitive Psychologist and coffee lover.
She decides to conduct a study investigating the
impact of coffee on quiz comprehension. She
randomly assigns participants to either the coffee
group or the placebo group. Thirty minutes before
the study begins, participants are given either a
cup of coffee to drink (the caffeine group) or a
cup of decaffeinated coffee to drink (the placebo
group/no caffeine group) while they sit in the
waiting room. Participants are not told whether
they are drinking regular coffee or decaffeinated
coffee. Following the thirty minutes, participants
enter the lab and are asked to read a passage of
text. After a short delay, participants are given a
quiz to complete where they answer a series of 10
questions about the passage they read earlier. Ana
is measuring the number of correct answers on
the quiz. Unfortunately, one participant did not
show up, so Ana was left with unequal sample
sizes: Five participants in the placebo group and 4
participants in the caffeine group. Ana is
interested in determining if
is a difference in
the number of quiz questions correctly answered
in the caffeine group relative to the placebo
group.
Use the data file, Caffeine.csv as needed to
answer the following:
d. With specific reference to the research
scenario described above, explain how the
calculation of pooled variance will be
influenced by the sample sizes in this study.
No calculations are required to answer this
question.
e. Calculate (by hand) and interpret Cohen's d
measure of effect size in this study. The
calculations you computed by hand need to
be clearly displayed along with an
interpretation of effect size.
f. Calculate (by hand) and report the
confidence interval. Please be sure to show
your calculations. Note, you will need to
consult the t-distribution table to identify the t
critical value.
g. Does the confidence interval you computed
in question f) imply a statistically significant
result? Explain.
Expert Solution
This question has been solved!
Explore an expertly crafted, step-by-step solution for a thorough understanding of key concepts.
This is a popular solution
Trending nowThis is a popular solution!
Step by stepSolved in 4 steps with 6 images

Knowledge Booster
Similar questions
- The accompanying data table lists measures of self-esteem from a student project. The objective of the project was to study how levels of self-esteem in subjects relate to their perceptions of self-esteem in other target people who were described in writing. The test here works well even though the data are at the ordinal level of measurement. Use a 0.05 significance level and apply the methods of two-way analysis of variance. What is the conclusion? Click on the icon to view the data table. F = 5.48 (Round to two decimal places as needed.) What is the corresponding P-value of the test statistic, F, for this test? P-value = 0.006 (Round to three decimal places as needed.) State the conclusion of this test. Reject Ho. There is sufficient evidence to warrant rejection of the claim that measurems of self-esteem are not affected by an interaction between the subject's self-esteem and the target's self- esteem. There does appear to be an effect from an interaction between the self-esteem of…arrow_forwardUse the following ANOVA table to answer the question. Source Regression Error Total DF MS SS 355.22 177.61 10.91 2 76.38 431.60 7 How many observations were in the data set used to create this model? (i.e. what is n?) 18 15 10 9.arrow_forwardTo determine if their 3.00 centimeter washers are properly adjusted, Hutcheson & Gregory Manufacturing has decided to use an x-Chart which uses the range to estimate the variability in the sample. Perioa ODS I 1 2 3 4 5 6 7 8 9 10 11 12 13 14 15 16 17 18 18 4 ODSZ ODS3 ODS4 ODS5 Opsb 3.04 2.99 3.01 2.98 3.04 3.04 2.99 3.03 3.01 2.95 3.0017 3.00 2.96 3.0050 2.96 3.00 3.00 3.00 2.99 3.00 2.9917 3.02 3.03 3.03 2.96 3.00 2.97 3.00 2.96 2.97 3.01 3.01 2.99 3.01 3.04 2.96 3.00 2.98 3.0033 3.04 2.9917 3.0017 3.03 2.97 2.96 2.96 2.99 3.01 2.9867 2.97 2.97 3.03 3.01 3.0033 3.00 3.04 3.04 2.98 3.0000 2.98 3.00 2.9967 2.98 3.01 3.02 3.03 2.96 3.01 3.02 2.97 2.9900 2.98 3.01 2.9 2.97 2.96 2.9767 2.95 3.01 2.98 3.03 2.98 2.98 2.9883 2.99 2.95 2.97 3.01 2.99 2.9900 3.03 2.98 2.97 2.9800 2.99 2.97 2.95 3.02 2.96 2.98 3.04 3.04 2.97 3.05 3.0067 2.98 2.97 3.01 3.03 2.97 2.96 2.9867 2.96 2.96 2.97 2.96 2.9800 3.00 3.01 2.95 3.02 2.99 2.95 Sample Mean 3.03 3.00 Table Control Chart Sampie Range 0.09 0.08…arrow_forward
- From the list below of the data being collected, identify which data would be considered variable data: Select ALL correct answers. Door closing speed at Honda Time before a call is answered at a call center Number of mistakes/miss-information given per call at a call center Percentage of medical bills with more than one defect Number of defects on one medical bill Weight of a golf ball Meal delivery time at a restaurant Number of orders with incorrect products per every 100 sampled at Amazon NEXT QUESTION From the list below of the data being collected, identify which data would be considered attribute data: Select ALL correct answers. Door closing speed at Honda Time before a call is answered at a call center Number of mistakes/miss-information given per call at a call center Percentage of medical bills with more than one defect Number of defects on one medical bill Weight of a golf ball Meal delivery time at a restaurant…arrow_forwardConsider the following set of data:Suppose the test statistic turned out to be z = -1.20 (not the correct value). Find a two-tailed p-value for this test statistic. Select one: A. p-value = .6151 B. p-value = .3849 C. p-value = .2302 D. p-value = .1151arrow_forwardNumber of Jobs A sociologist found that in a sample of 50 retired men, the average number of jobs they had during their lifetimes was 7.3. The population standard deviation is 2.1 (b) Find the 99% confidence interval of the mean number of jobs. Round intermediate and final answers to one decimal place. < μ <arrow_forward
- Q18. Why do we conduct post hoc analysis in ANOVA? a. To make a comparison on individual adjusted R-squares B. To make a comparison of the individual group meansC. To make a comparison of the individual group scatter plots D. None of the abovearrow_forwardIn each of the following settings, decide whether the samples are independent or dependent. Explain your choice.a. To test the wear characteristics of two tire brands, A and B, each brand of tire is randomly assigned to 50 cars of the same make and model.independentb. To test the effect of background music on productivity, factory workers are observed. For one month, each subject works without music. For another month, the subject works while listening to music on an MP3 player. The month in which each subject listens to music is determined by a coin toss.dependentc. A study was designed to compare the effectiveness of two weight-reducing diets. Fifty obese women who volunteered to participate were randomly assigned into two equal-sized groups. One group used Diet A and the other used Diet B. The weight of each woman was measured before the diet was assigned and again after 10 weeks on the diet.dependentarrow_forwardCourse/Year 1. Brian, a college administrator, claimed that there was no difference in averages of students coming from three nearby schools A, B, and C. Use the following data to test his claim with a 1% significance level. Ex A-420 2x² 253 Ex B 340 SANOVA Table: 4 Source of Variation Between - column Within - column Total A A. Ho: B. a: 0.01 C. B C 3 _M₁ = M₁₂₁ = M²3 Sum of Squares 2.25 Compute for sum of squares D. Compute for degrees of freedom 84 88 88 E. Compute for mean sum of squares F. Compute for F-value 82 83 80 df 2 Ha: STUDENTS 89 82 89 Mean Sum of Squares 85 83 80 F-value Mr & Mr & M²₂ n₁ = √=n²₁₂₁ = 3 - N = 12 7 Critical Value / Tabular Value Decisionarrow_forward
- If an analysis of variance is used for the following data, what would be the effect of changing the value of M2 to 20? Sample Data M1 = 10 M2 = 15 SS1 = 90 SS2 = 70 a. Increase SSbetween and increase the size of the F-ratio. b. Increase SSbetween and decrease the size of the F-ratio. c. Decrease SSbetween and increase the size of the F-ratio. d. Decrease SSbetween and decrease the size of the F-ratio.arrow_forwardWhich of the following is NOT a misuse of statistics?Choose the correct answer below.A.Utilizing valid statistical methods and correct sampling techniquesB.Concluding that a variable causes another variable because they have some correlationC.Misleading graphsD.Making conclusions about a population based on a voluntary response samplearrow_forwardWhich of the following are the names commonly used for the variable Y in sample regression? 1. covariate variable 2. independent variable 3. predictor variable 4. Explained variable 5. Response variable 6. explanatory variable 7. Predicted variable 8. Dependent variable 9. Criterion variablearrow_forward
arrow_back_ios
SEE MORE QUESTIONS
arrow_forward_ios
Recommended textbooks for you
 MATLAB: An Introduction with ApplicationsStatisticsISBN:9781119256830Author:Amos GilatPublisher:John Wiley & Sons Inc
 Probability and Statistics for Engineering and th...StatisticsISBN:9781305251809Author:Jay L. DevorePublisher:Cengage Learning
 Statistics for The Behavioral Sciences (MindTap C...StatisticsISBN:9781305504912Author:Frederick J Gravetter, Larry B. WallnauPublisher:Cengage Learning
 Elementary Statistics: Picturing the World (7th E...StatisticsISBN:9780134683416Author:Ron Larson, Betsy FarberPublisher:PEARSON
 The Basic Practice of StatisticsStatisticsISBN:9781319042578Author:David S. Moore, William I. Notz, Michael A. FlignerPublisher:W. H. Freeman
 Introduction to the Practice of StatisticsStatisticsISBN:9781319013387Author:David S. Moore, George P. McCabe, Bruce A. CraigPublisher:W. H. Freeman

MATLAB: An Introduction with Applications
Statistics
ISBN:9781119256830
Author:Amos Gilat
Publisher:John Wiley & Sons Inc

Probability and Statistics for Engineering and th...
Statistics
ISBN:9781305251809
Author:Jay L. Devore
Publisher:Cengage Learning

Statistics for The Behavioral Sciences (MindTap C...
Statistics
ISBN:9781305504912
Author:Frederick J Gravetter, Larry B. Wallnau
Publisher:Cengage Learning

Elementary Statistics: Picturing the World (7th E...
Statistics
ISBN:9780134683416
Author:Ron Larson, Betsy Farber
Publisher:PEARSON

The Basic Practice of Statistics
Statistics
ISBN:9781319042578
Author:David S. Moore, William I. Notz, Michael A. Fligner
Publisher:W. H. Freeman

Introduction to the Practice of Statistics
Statistics
ISBN:9781319013387
Author:David S. Moore, George P. McCabe, Bruce A. Craig
Publisher:W. H. Freeman