
MATLAB: An Introduction with Applications
6th Edition
ISBN: 9781119256830
Author: Amos Gilat
Publisher: John Wiley & Sons Inc
expand_more
expand_more
format_list_bulleted
Related questions
Question
This is the second part of the question.
Please provide the excel formula, the correct EXCEL FORMULA.

Transcribed Image Text:File
Home
Insert
Draw
Formulas
Data
Review
View
Help
Ø Editing v
Calibri
B
v A
$v 囲、ラ、國
...
General
00
00
A1
fx Accessibility tab summary: Given information for this question is presented in rows 2 through 17. Requirement information is presented in rows 20 through 32.
A.
B
E
F
G
H
M
1.
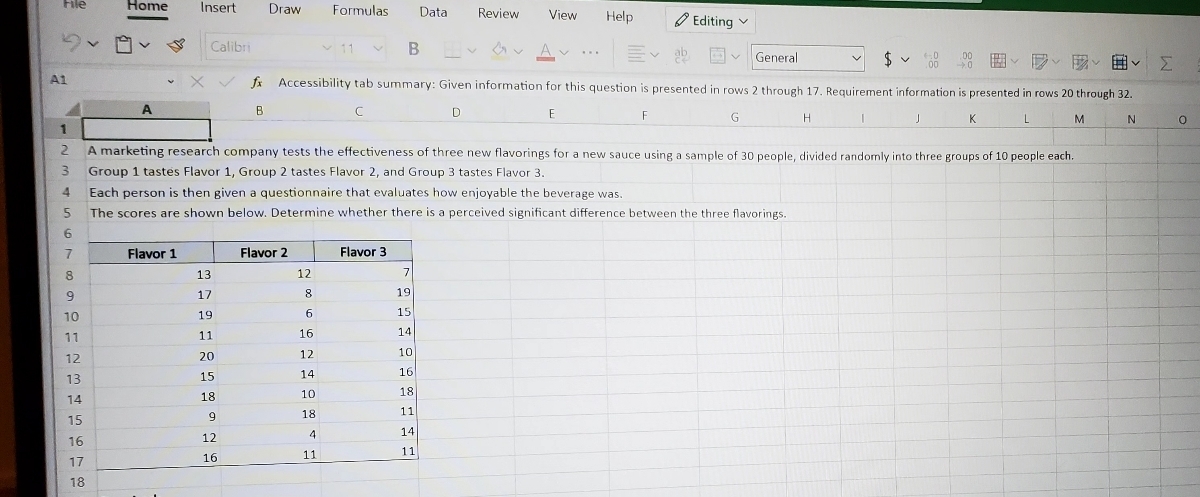
A marketing research company tests the effectiveness of three new flavorings for a new sauce using a sample of 30 people, divided randomly into three groups of 10 people each.
3.
Group 1 tastes Flavor 1, Group 2 tastes Flavor 2, and Group 3 tastes Flavor 3.
4.
Each person is then given a questionnaire that evaluates how enjoyable the beverage was.
5.
The scores are shown below. Determine whether there is a perceived significant difference between the three flavorings.
6.
Flavor 1
Flavor 2
Flavor 3
13
12
9
17
8
19
10
19
6
15
11
11
16
14
12
20
12
10
15
14
16
13
18
10
18
14
9
18
11
15
4
14
16
12
11
11
16
17
18

Transcribed Image Text:A1
fx Accessibility tab summary: Given information for this question is presented in rows 2 through 17. Requirement information is p
B
E
F
18
19 Required:
20 Complete the ANOVA tables below:
21
Groups
Count
Sum
Mean
Variance
SS
22
Flavor 1
23
Flavor 2
24 Flavor 3
25
26 ANOVA
Alpha
0.05
SS
df
MS
P value
F crit
27
Sources
28 Between Groups
29 within Groups
30 Total
31
alpha,
do not reject
the null hypothesis.
32 Since p-value is
33
34
35
36 Students: The scratchpad area is for you to do any additional work you need to solve this question or can be used to show your work.
37 Nothing in this area will be graded, but it will be submitted with your assignment.
38
A Graded Worksheet
II
Expert Solution
This question has been solved!
Explore an expertly crafted, step-by-step solution for a thorough understanding of key concepts.

This is a popular solution

Trending nowThis is a popular solution!

Step by stepSolved in 2 steps with 4 images

Knowledge Booster

Similar questions
- A company earned $1.8 billion during 1 year, with 1.03 billion outstanding shares of stock. Find the EPS (in dollars) for this company. Round to the nearest cent.arrow_forwardA 35% discount on a smart phone amounts to $665. What is the phone's list price? Answer = $ (rounded to the nearest cent)arrow_forwardPlease do not give solution in image format thanku Rural share of the US population is 13% (the rest of the population is urban). We want to take a stratified sample from the US population with the size of "6 hundred". Out of "6 hundred", how many should be rural?arrow_forward
- About 3.2 million SMART boards have been sold, 2.8 million to schools. What is the ratio of the number of SMART boards in schools to the number of SMART boards not in schools?arrow_forwardThe scatter plot shows the total number of rebounds caught and the total number of points scored for the five starting players of the Cleveland Cavaliers and of the Golden State Warriors in game 7 of the 2016 NBA finals. How many rebounds did the Warriors player who scored the most points catch? Please enter your answer as a whole numberarrow_forward
arrow_back_ios
arrow_forward_ios
Recommended textbooks for you
- MATLAB: An Introduction with ApplicationsStatisticsISBN:9781119256830Author:Amos GilatPublisher:John Wiley & Sons Inc
 Probability and Statistics for Engineering and th...StatisticsISBN:9781305251809Author:Jay L. DevorePublisher:Cengage Learning
 Statistics for The Behavioral Sciences (MindTap C...StatisticsISBN:9781305504912Author:Frederick J Gravetter, Larry B. WallnauPublisher:Cengage Learning
  Elementary Statistics: Picturing the World (7th E...StatisticsISBN:9780134683416Author:Ron Larson, Betsy FarberPublisher:PEARSON
 The Basic Practice of StatisticsStatisticsISBN:9781319042578Author:David S. Moore, William I. Notz, Michael A. FlignerPublisher:W. H. Freeman
 Introduction to the Practice of StatisticsStatisticsISBN:9781319013387Author:David S. Moore, George P. McCabe, Bruce A. CraigPublisher:W. H. Freeman
MATLAB: An Introduction with Applications
Statistics
ISBN:9781119256830
Author:Amos Gilat
Publisher:John Wiley & Sons Inc
Probability and Statistics for Engineering and th...
Statistics
ISBN:9781305251809
Author:Jay L. Devore
Publisher:Cengage Learning
Statistics for The Behavioral Sciences (MindTap C...
Statistics
ISBN:9781305504912
Author:Frederick J Gravetter, Larry B. Wallnau
Publisher:Cengage Learning
Elementary Statistics: Picturing the World (7th E...
Statistics
ISBN:9780134683416
Author:Ron Larson, Betsy Farber
Publisher:PEARSON
The Basic Practice of Statistics
Statistics
ISBN:9781319042578
Author:David S. Moore, William I. Notz, Michael A. Fligner
Publisher:W. H. Freeman
Introduction to the Practice of Statistics
Statistics
ISBN:9781319013387
Author:David S. Moore, George P. McCabe, Bruce A. Craig
Publisher:W. H. Freeman