
MATLAB: An Introduction with Applications
6th Edition
ISBN: 9781119256830
Author: Amos Gilat
Publisher: John Wiley & Sons Inc
expand_more
expand_more
format_list_bulleted
Related questions
Topic Video
Question
I need assistance with this question number 3. IN the picture attached I provided my results for questions 2.
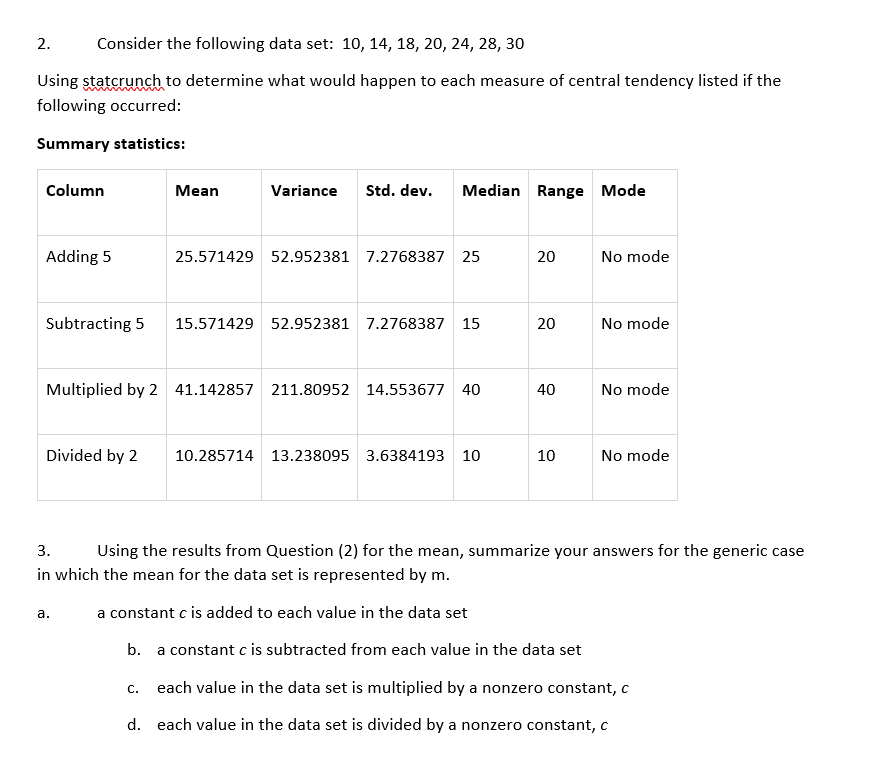

Transcribed Image Text:Consider the following data set: 10, 14, 18, 20, 24, 28, 30
2.
Using statcrunch to determine what would happen to each measure of central tendency listed if the
following occurred:
Summary statistics
Std. dev
Column
Median Range Mode
Мean
Variance
Adding 5
No mode
25.571429 52.952381 7.2768387 25
15.571429 52.952381 7.276838715
Subtracting 5
No mode
20
Multiplied by 2 41.142857 211.80952 14.55367740
No mode
40
Divided by 2
No mode
10.285714 13.238095 3.6384193
10
10
Using the results from Question (2) for the mean, summarize your answers for the generic case
3.
in which the mean for the data set is represented by m.
a constant c is added to each value in the data set
а.
b.
a constant c is subtracted from each value in the data set
each value in the data set is multiplied by
a nonzero constant, c
C.
each value in the data set is divided by a nonzero constant, c
d.
20
Expert Solution
This question has been solved!
Explore an expertly crafted, step-by-step solution for a thorough understanding of key concepts.

This is a popular solution

Trending nowThis is a popular solution!

Step by stepSolved in 6 steps with 5 images

Knowledge Booster


Learn more about
Need a deep-dive on the concept behind this application? Look no further. Learn more about this topic, statistics and related others by exploring similar questions and additional content below.Similar questions
- According to the the question above please answer the rest of the questions: questions 4 to 6arrow_forwardI just need help with the answers. The questions are attached on the image and it would be helpful if you could list the steps out. Only 13 to 15arrow_forwardPlease help me answer the following questions. Thank youarrow_forward
arrow_back_ios
arrow_forward_ios
Recommended textbooks for you
- MATLAB: An Introduction with ApplicationsStatisticsISBN:9781119256830Author:Amos GilatPublisher:John Wiley & Sons Inc
 Probability and Statistics for Engineering and th...StatisticsISBN:9781305251809Author:Jay L. DevorePublisher:Cengage Learning
 Statistics for The Behavioral Sciences (MindTap C...StatisticsISBN:9781305504912Author:Frederick J Gravetter, Larry B. WallnauPublisher:Cengage Learning
  Elementary Statistics: Picturing the World (7th E...StatisticsISBN:9780134683416Author:Ron Larson, Betsy FarberPublisher:PEARSON
 The Basic Practice of StatisticsStatisticsISBN:9781319042578Author:David S. Moore, William I. Notz, Michael A. FlignerPublisher:W. H. Freeman
 Introduction to the Practice of StatisticsStatisticsISBN:9781319013387Author:David S. Moore, George P. McCabe, Bruce A. CraigPublisher:W. H. Freeman
MATLAB: An Introduction with Applications
Statistics
ISBN:9781119256830
Author:Amos Gilat
Publisher:John Wiley & Sons Inc
Probability and Statistics for Engineering and th...
Statistics
ISBN:9781305251809
Author:Jay L. Devore
Publisher:Cengage Learning
Statistics for The Behavioral Sciences (MindTap C...
Statistics
ISBN:9781305504912
Author:Frederick J Gravetter, Larry B. Wallnau
Publisher:Cengage Learning
Elementary Statistics: Picturing the World (7th E...
Statistics
ISBN:9780134683416
Author:Ron Larson, Betsy Farber
Publisher:PEARSON
The Basic Practice of Statistics
Statistics
ISBN:9781319042578
Author:David S. Moore, William I. Notz, Michael A. Fligner
Publisher:W. H. Freeman
Introduction to the Practice of Statistics
Statistics
ISBN:9781319013387
Author:David S. Moore, George P. McCabe, Bruce A. Craig
Publisher:W. H. Freeman