Advanced Engineering Mathematics
10th Edition
ISBN: 9780470458365
Author: Erwin Kreyszig
Publisher: Wiley, John & Sons, Incorporated
expand_more
expand_more
format_list_bulleted
Question

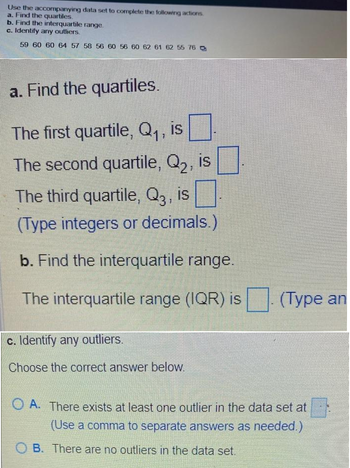
Transcribed Image Text:Use the accompanying data set to complete the following actions.
a. Find the quartiles.
b. Find the interquartile range.
c. Identify any outliers.
59 60 60 64 57 58 56 60 56 60 62 61 62 55 76
a. Find the quartiles.
The first quartile, Q₁, is
The second quartile, Q₂, is
The third quartile, Q3, is
(Type integers or decimals.)
b. Find the interquartile range.
The interquartile range (IQR) is
c. Identify any outliers.
Choose the correct answer below.
(Type an
OA. There exists at least one outlier in the data set at
(Use a comma to separate answers as needed.)
OB. There are no outliers in the data set.
Expert Solution
This question has been solved!
Explore an expertly crafted, step-by-step solution for a thorough understanding of key concepts.
Step by stepSolved in 4 steps

Knowledge Booster
Similar questions
- Identify the overall shape of the distribution and determine whether t the median would provide a better measure of center. Shown below is a histogram for the length of 50 iTunes songs. Lengths of iTunes Songs 25 20 15 10 100 200 300 400 500 600 700 800 900 Song Length (seconds) Skew left, the median would provide a better measure of center. Skew right, the mean would provide a better measure of center. O Skew left, the mean would provide a better measure of center. O Skew right, the median would provide a better measure of center. Frequency 5.arrow_forwardDetermine whether the following statement is true or false. If it is false, rewrite it as a true statement. The mean is the measure of central tendency most likely to be affected by an outlier. C Choose the correct answer below. OA. The statement is true. B. The statement is false. The mode is the measure of central tendency most likely to be affected by an outlier. OC. The statement is false. The median is the measure of central tendency most likely to be affected by an outlier. OD. The statement is false. Outliers do not affect any measure of central tendency.arrow_forwardThe tuition and fees (in thousands of dollars) for the top 14 universities in a recent year are listed below. Find the mean, median, and mode of the data, if possible. If any of these measures cannot be found or a measure does not represent the center of the data, explain why. 46 44 44 44 46 47 41 46 ㅁ 44 35 41 44 46 39arrow_forward
- Make a box-and-whisker plot. Label the minimum, maximum, first quartile, median, and third quartile. Daily Attendance: 29, 24, 28, 32, 30, 31, 26, 33 Show Your Workarrow_forwardSix damaged cars are selected and taken to bothgarages A and B for estimates. Find the 95% CI forthe difference between the population meanestimates for each garage. 1 2 3 4 5 6 A 890 900 910 710 990 650 B 880 1010 980 790 1042 600arrow_forwardplease answer A and B thank you.arrow_forward
- Which of these statistics BEST describes the relationship in this scatterplot? Group of answer choices r = –.45 r = .50 r = –1.00 r = .10arrow_forwardIQR and outliersarrow_forward= The data show the distance (in miles) from an airport of a sample of 22 inbound and outbound airplanes. Use technology to answer parts (a) and (b). a. Find the data set's first, second, and third quartiles. b. Draw a box-and-whisker plot that represents the data set. D 3.2 2.6 3.3 5.9 5.4 3.5 2.6 2.2 5.7 2.9 2.8 2.7 4.3 2.1 1.9 4.6 2.6 5.4 3.6 2.4 5.5 2.2 a. Find the three quartiles. Q₁ Q₂ d (Type integers or decimals. Do not round.) b. Choose the correct box-and-whisker plot below.arrow_forward
- Determine whether the following statement is true or false. If it is false, rewrite it as a true statement. The mean is the measure of central tendency most likely to be affected by an outlier. Choose the correct answer below. OA. The statement is true. OB. The statement is false. The median is the measure outlier. f central tendency most likely t OC. The statement is false. The mode is the measure OD. The statement is false. Outliers do not affect any measure of central tendency. affected by an central tendency most likely to be affected by an outlier.arrow_forwardDetermine whether the following statement is true or false. If it is false, rewrite it as a true statement. The mean is the measure of central tendency most likely to be affected by an outlier. Choose the correct answer below. OA. The statement is false. Outliers do not affect any measure of central tendency. B. The statement is false. The mode is the measure of central tendency most likely to be affected by an outlier. OC. The statement is false. The median is the measure of central tendency most likely to be affected by an outlier. OD. The statement is true.arrow_forwardConsider the following data set: 33 22 18 35 14 Find the 40th percentile for this data. 40th percentile = 20arrow_forward
arrow_back_ios
SEE MORE QUESTIONS
arrow_forward_ios
Recommended textbooks for you
 Advanced Engineering MathematicsAdvanced MathISBN:9780470458365Author:Erwin KreyszigPublisher:Wiley, John & Sons, Incorporated
 Numerical Methods for EngineersAdvanced MathISBN:9780073397924Author:Steven C. Chapra Dr., Raymond P. CanalePublisher:McGraw-Hill Education
 Introductory Mathematics for Engineering Applicat...Advanced MathISBN:9781118141809Author:Nathan KlingbeilPublisher:WILEY
 Mathematics For Machine TechnologyAdvanced MathISBN:9781337798310Author:Peterson, John.Publisher:Cengage Learning,


Advanced Engineering Mathematics
Advanced Math
ISBN:9780470458365
Author:Erwin Kreyszig
Publisher:Wiley, John & Sons, Incorporated

Numerical Methods for Engineers
Advanced Math
ISBN:9780073397924
Author:Steven C. Chapra Dr., Raymond P. Canale
Publisher:McGraw-Hill Education

Introductory Mathematics for Engineering Applicat...
Advanced Math
ISBN:9781118141809
Author:Nathan Klingbeil
Publisher:WILEY

Mathematics For Machine Technology
Advanced Math
ISBN:9781337798310
Author:Peterson, John.
Publisher:Cengage Learning,

