MATLAB: An Introduction with Applications
6th Edition
ISBN: 9781119256830
Author: Amos Gilat
Publisher: John Wiley & Sons Inc
expand_more
expand_more
format_list_bulleted
Question

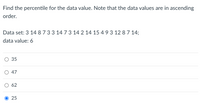
Transcribed Image Text:Find the percentile for the data value. Note that the data values are in ascending
order.
Data set: 3 14 8733 14 73 14 2 14 15 49 3 12 8 7 14;
data value: 6
О35
47
62
O 25
Expert Solution
This question has been solved!
Explore an expertly crafted, step-by-step solution for a thorough understanding of key concepts.
Step by stepSolved in 2 steps with 2 images

Knowledge Booster
Similar questions
- Find the five-number summary for the data in the histogram shown. 3 2.5 2 1.5 1 0. 1 2 3 4 5 6 7 8 9 10 11 Data doumbatarrow_forwardA local, family-owned restaurant also gathered data for two weeks of orders. The following set of data represents the number of orders filled by this restaurant during a two week period. Construct a five number summary for the the data. 82, 81, 65, 62, 86, 81, 83, 62, 81, 81, 68, 71, 85, 62, 87 (Round to the nearest hundredth, if needed). Min _______________________ Lower Quartile _______________________ Median ________________________ Upper Quartile _________________________ Maximum __________________________ What is the range and interquartile range for the family-owned restaurant? Range ___________________________ Interquartile Range ____________________________ Considering this data only, did the national-chain restaurant or the family-owned restaurant do better for the past two weeks? _______________________________________arrow_forwardFind the mode of the data set: 13, 32, 25, 27, 13 O 22 O 13 O 24.5 O 25 Eo search F3 F4 F5 F6 F7 F8 F9 2$ % &arrow_forward
- Find the percentile for the data point. Data set: 51 33 41 72 74 75 32;data point 51arrow_forwardFind the following for the data shown: 1 5 14 17 30 31 39 44 49 55 74 86 94 100 What is the percentile of the data value 44? Round to the nearest whole number. Which data value represents the 20th percentile?arrow_forwardSix damaged cars are selected and taken to bothgarages A and B for estimates. Find the 95% CI forthe difference between the population meanestimates for each garage. 1 2 3 4 5 6 A 890 900 910 710 990 650 B 880 1010 980 790 1042 600arrow_forward
- A veterinarian recorded how many kittens were born in each litter. This data is summarized in the histogram below. (Note: The last class actually represents "7 or more kittens," not just 7 kittens.) QUESTIONL: What is the frequency of the litter having at most 2 kittens? (PHOTO ATTACHED)arrow_forward3. Find the percentile for the data value 29 . Data: 9 10 10 11 13 14 16 17 17 18 19 20 22 23 25 27 28 29 30 32 33 34 36 37 39 40 41 42 44 46 49 50 53 55 56arrow_forwardFind the 5 number summary for the data shown 13 24 27 28 38 45 46 48 52 78 84 90 5 number summary: Use the Locator/Percentile method described in your book, not your calculator. Add Work Check Answerarrow_forward
- Given the data set: 6, 19, 17, 23, 20, 10. Determine (i). the percentile rank for each test score,arrow_forwardFind the percentile for the data value. Data set: 20 20 70 40 20 50 90 90 110 30 20 90 60 10 90; Data value:70arrow_forwardUse the following cell phone airport data speeds (Mbps) from a particular network. Find the percentile corresponding to the data speed 0.9 Mbps. Percentile of 0.9 equals (Round to the nearest whole number as needed.)arrow_forward
arrow_back_ios
SEE MORE QUESTIONS
arrow_forward_ios
Recommended textbooks for you
 MATLAB: An Introduction with ApplicationsStatisticsISBN:9781119256830Author:Amos GilatPublisher:John Wiley & Sons Inc
 Probability and Statistics for Engineering and th...StatisticsISBN:9781305251809Author:Jay L. DevorePublisher:Cengage Learning
 Statistics for The Behavioral Sciences (MindTap C...StatisticsISBN:9781305504912Author:Frederick J Gravetter, Larry B. WallnauPublisher:Cengage Learning
 Elementary Statistics: Picturing the World (7th E...StatisticsISBN:9780134683416Author:Ron Larson, Betsy FarberPublisher:PEARSON
 The Basic Practice of StatisticsStatisticsISBN:9781319042578Author:David S. Moore, William I. Notz, Michael A. FlignerPublisher:W. H. Freeman
 Introduction to the Practice of StatisticsStatisticsISBN:9781319013387Author:David S. Moore, George P. McCabe, Bruce A. CraigPublisher:W. H. Freeman

MATLAB: An Introduction with Applications
Statistics
ISBN:9781119256830
Author:Amos Gilat
Publisher:John Wiley & Sons Inc

Probability and Statistics for Engineering and th...
Statistics
ISBN:9781305251809
Author:Jay L. Devore
Publisher:Cengage Learning

Statistics for The Behavioral Sciences (MindTap C...
Statistics
ISBN:9781305504912
Author:Frederick J Gravetter, Larry B. Wallnau
Publisher:Cengage Learning

Elementary Statistics: Picturing the World (7th E...
Statistics
ISBN:9780134683416
Author:Ron Larson, Betsy Farber
Publisher:PEARSON

The Basic Practice of Statistics
Statistics
ISBN:9781319042578
Author:David S. Moore, William I. Notz, Michael A. Fligner
Publisher:W. H. Freeman

Introduction to the Practice of Statistics
Statistics
ISBN:9781319013387
Author:David S. Moore, George P. McCabe, Bruce A. Craig
Publisher:W. H. Freeman