
MATLAB: An Introduction with Applications
6th Edition
ISBN: 9781119256830
Author: Amos Gilat
Publisher: John Wiley & Sons Inc
expand_more
expand_more
format_list_bulleted
Related questions
Topic Video
Question
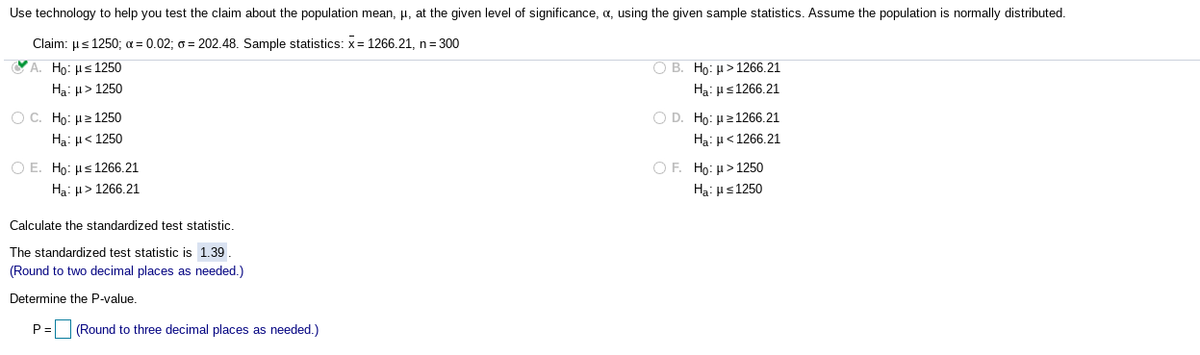

Transcribed Image Text:Use technology to help you test the claim about the population mean, µ, at the given level of significance, a, using the given sample statistics. Assume the population is normally distributed.
Claim: µs 1250; a = 0.02; o = 202.48. Sample statistics: x= 1266.21, n= 300
ΥΑ Ho με 1250
O B. Ho: H > 1266.21
Ha: µ> 1250
Ha: us1266.21
Ο D. Ho: μ2 1266.21
Ha: µ< 1266.21
Oc H μ2 1250
Ha: H< 1250
ΟΕ Ho:μ > 1250
O E. Ho: µs 1266.21
Ha: µ> 1266.21
Ha: us1250
Calculate the standardized test statistic.
The standardized test statistic is 1.39
(Round to two decimal places as needed.)
Determine the P-value.
P =
(Round to three decimal places as needed.)
Expert Solution
This question has been solved!
Explore an expertly crafted, step-by-step solution for a thorough understanding of key concepts.

Step by stepSolved in 5 steps with 4 images

Knowledge Booster


Learn more about
Need a deep-dive on the concept behind this application? Look no further. Learn more about this topic, statistics and related others by exploring similar questions and additional content below.Similar questions
- Find the weighted estimate, p to test the claim that p, p2. Use a= 0.02. The sample statistics listed below are from independent samples. n, = 1000, x, = 250, and n, = 1200, x, = 195 3D195 一 O A. 0.789 O B. 0.202 OC. 0.138 O D. 0.110 uc OFarrow_forward:Lesson 9.4 Certify Mode Questio X C Chegg Search Course Hero C'.A A learn.hawkeslearning.com/Portal/Lesson/lesson_certify#! + Save & Exit Certify Lesson: 9.4 Comparing Two Population Pr. LORETTA STONE 5/20 Question 3 of 9, Step 2 of 2 Correct Determine whether the normal distribution can be used to compare the following population proportions. ni = 29, n2 = 48, P, = 0.897, p, = 0.604 Step 2 of 2: Are the conditions for using the normal distribution met? Answer 囲Tables E Keypad Keyboard Shortcuts O The conditions are not met so the normal distribution can be used. O The conditions are not met so the normal distribution cannot be used. O The conditions are met so the normal distribution can be used. O Not enough information to determine. Submit Answer © 2021 Hawkes Learningarrow_forwardAssume that you want to test the claim that the paired sample data below come from a population from which the mean difference is zero. Using JMP, compute the value of the appropriate test statistic. Do the data appear to come from a population where the mean difference is zero? X: 28 35 25 25 32 30 28 37 Y: 26 31 31 25 33 35 28 33 a. No b. O c. Yes d.arrow_forward
- In the population of senior students at Shermer High School, the proportion who plan to attend college is 0.64. In a random sample of 100 students from this population, the proportion who plan to attend college is 0.75. We would call the value 0.64 a P-value. z-score. parameter statistic significance level.arrow_forwardCalculate the standard score (z-score) of the given sample mean. Round your answer to two decimal places. μ=29μ=29 and σ=8σ=8; n=66n=66; x¯=28arrow_forwardThe amount of trash generated by US households (in lbs per day) is normally distributed. You take a sample of 10 people. The sample average is xbar=10.91 lbs, and the sample standard deviation is s=4.736. What is the 99% Conf. Int. for the mean? Group of answer choices a. 6.04 to 15.78 b. 8.33 to 13.49 c. 8.09 to 13.73 d. 7.74 to 14.08arrow_forward
- Use technology to help you test the claim about the population mean, p, at the given level of significance, a, using the given sample statistics. Assume the population is normally distributed. Claim: u > 1280; a = 0.07; o = 196.31. Sample statistics: x= 1308.11, n= 200 H p> 1280 Ha: p 1308.11 O D. Ho: Hs 1308.11 Ha ps 1308.11 Ha: p> 1308.11 O E. H, p> 1280 O F. Ho: µ2 1280 Ha: u< 1280 Ha ps 1280 Calculate the standardized test statistic. The standardized test statistic is 2.03. (Round to two decimal places as needed.) Determine the P-value. P 3D (Round to three decimal places as needed.)arrow_forwardDetermine whether the given value is from a discrete or continuous data set. An impact SUV has a gas tank that can hold 15.21 gal.arrow_forwardUse technology to help you test the claim about the population mean, , at the given level of significance, a, using the given sample statistics. Assume the population is normally distributed. Claim: u> 1240; a = 0.09; o = 208.13. Sample statistics: x= 1267.96, n= 300 O E. Ho: us 1267.96 O F. Ho µ> 1267.96 Ha p> 1267.96 Ha µs 1267.96 Calculate the standardized test statistic. The standardized test statistic is (Round to two decimal places as needed.) Determine the P-value. P = (Round to three decimal places as needed.) Determine the outcome and conclusion of the test. V Ho. At the 9% significance level, there V enough evidence to the claim.arrow_forward
- instructor thinks that the mean score is higher. She samples 10 statistics students and obtains the scores: Grades 63.9 68.4 | 69 | 96 64.3 | 63.9 65 69 62.7 68.4 Test grades are believed to be normally distributed. Use a significance level of 5%. A. State the alternative hypothesis: HA: Ou + 65 Ομ 65 B. State the mean of the sample: C. State the standard error of the sample means:arrow_forwardUse the standard normal table to find the z-score that corresponds to the given percentile. If the area is not in the table, use the entry closest to the area. If the area is halfway between two entries, use the z-score halfway between the corresponding z-scores. If convenient, use technology to find the z-score. P65arrow_forwardThe EPA tests cars for city miles per gallon (mpg). For one model, a sample of 16 cars were tested for mpg, the results follow. 28 25.7 25.8 28 28.5 29.8 30.2 30.4 26.9 28.3 29.8 27.2 26.7 27.7 29.5 28 1) What is point estimate of the mean mpg?arrow_forward
arrow_back_ios
SEE MORE QUESTIONS
arrow_forward_ios
Recommended textbooks for you
- MATLAB: An Introduction with ApplicationsStatisticsISBN:9781119256830Author:Amos GilatPublisher:John Wiley & Sons Inc
 Probability and Statistics for Engineering and th...StatisticsISBN:9781305251809Author:Jay L. DevorePublisher:Cengage Learning
 Statistics for The Behavioral Sciences (MindTap C...StatisticsISBN:9781305504912Author:Frederick J Gravetter, Larry B. WallnauPublisher:Cengage Learning
  Elementary Statistics: Picturing the World (7th E...StatisticsISBN:9780134683416Author:Ron Larson, Betsy FarberPublisher:PEARSON
 The Basic Practice of StatisticsStatisticsISBN:9781319042578Author:David S. Moore, William I. Notz, Michael A. FlignerPublisher:W. H. Freeman
 Introduction to the Practice of StatisticsStatisticsISBN:9781319013387Author:David S. Moore, George P. McCabe, Bruce A. CraigPublisher:W. H. Freeman
MATLAB: An Introduction with Applications
Statistics
ISBN:9781119256830
Author:Amos Gilat
Publisher:John Wiley & Sons Inc
Probability and Statistics for Engineering and th...
Statistics
ISBN:9781305251809
Author:Jay L. Devore
Publisher:Cengage Learning
Statistics for The Behavioral Sciences (MindTap C...
Statistics
ISBN:9781305504912
Author:Frederick J Gravetter, Larry B. Wallnau
Publisher:Cengage Learning
Elementary Statistics: Picturing the World (7th E...
Statistics
ISBN:9780134683416
Author:Ron Larson, Betsy Farber
Publisher:PEARSON
The Basic Practice of Statistics
Statistics
ISBN:9781319042578
Author:David S. Moore, William I. Notz, Michael A. Fligner
Publisher:W. H. Freeman
Introduction to the Practice of Statistics
Statistics
ISBN:9781319013387
Author:David S. Moore, George P. McCabe, Bruce A. Craig
Publisher:W. H. Freeman