MATLAB: An Introduction with Applications
6th Edition
ISBN: 9781119256830
Author: Amos Gilat
Publisher: John Wiley & Sons Inc
expand_more
expand_more
format_list_bulleted
Question

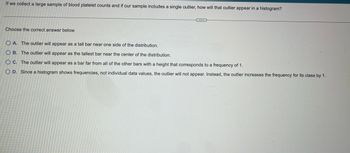
Transcribed Image Text:If we collect a large sample of blood platelet counts and if our sample includes a single outlier, how will that outlier appear in a histogram?
Choose the correct answer below.
OA. The outlier will appear as a tall bar near one side of the distribution.
OB. The outlier will appear as the tallest bar near the center of the distribution.
OC. The outlier will appear as a bar far from all of the other bars with a height that corresponds to a frequency of 1.
O D. Since a histogram shows frequencies, not individual data values, the outlier will not appear. Instead, the outlier increases the frequency for its class by 1.
Expert Solution
This question has been solved!
Explore an expertly crafted, step-by-step solution for a thorough understanding of key concepts.
This is a popular solution
Trending nowThis is a popular solution!
Step by stepSolved in 3 steps

Knowledge Booster
Similar questions
- PLEASE PROVIDE TYPED ANSWERS TYPED ANSWERS.arrow_forwardDetermine whether the following statement is true or false. If it is false, rewrite it as a true statement. The mean is the measure of central tendency most likely to be affected by an outlier. C Choose the correct answer below. OA. The statement is true. B. The statement is false. The mode is the measure of central tendency most likely to be affected by an outlier. OC. The statement is false. The median is the measure of central tendency most likely to be affected by an outlier. OD. The statement is false. Outliers do not affect any measure of central tendency.arrow_forwardshow how to answer and put into graphing calculator. Ppool = .126arrow_forward
- The population median is a. All of the above b. None of the above c. A measure that is easily skewed by outliers and or high influence points ( Micheal Jordan effect) d. A measure of dispersionarrow_forwardIdentify the sample chosen for the study. The number of times 13 out of 22 students on your floor order take-out in a week. Answer O All students who order take-out in a week. O The 13 students on your floor. O The 22 students on your floor.arrow_forwardThe following data represent the weight (in grams) of a random sample of 13 medicine tablets. Find the five-number summary, and construct a boxplot for the data. Comment on the shape of the distribution. 0 605 0.607 0.608 0.609 0.610 0.599 0.612 0.610 0.605 0.610 0.612 0.600 0.610 The five-number summary is IILI (Use ascending order.) Choose the correct boxplot of the data below. OA. O B. OC. 0.6 0.61 0.6 0.61 0.6 0.61arrow_forward
- 13arrow_forwardCalculate the 5-number summary of this numerical distribution, and also the IQR and outlier boundaries. Draw a box plot to show all that information. 18, 14, 27, 35, 7, 16, 21, 20, 28, 19arrow_forwardDetermine whether the following statement is true or false. If it is false, rewrite it as a true statement. The mean is the measure of central tendency most likely to be affected by an outlier. Choose the correct answer below. OA. The statement is false. Outliers do not affect any measure of central tendency. B. The statement is false. The mode is the measure of central tendency most likely to be affected by an outlier. OC. The statement is false. The median is the measure of central tendency most likely to be affected by an outlier. OD. The statement is true.arrow_forward
- 2. For the data set below, do a complete boxplot analysis. This includes finding the quartiles, the range, the interquartile range, inner fences, and outer fences. Make sure you draw the graph. Then tell me whether the highest observation is reliable, a mild outlier, or an extreme outlier. 9, 11, 13, 14, 16, 17, 17, 18, 19, 20, 35.arrow_forward8. Construct a box plot for the following data by finding the min, Q1, median, Q3, the max, and the IQR. 59, 50, 65, 68, 72, 80, 82arrow_forwardDiscuss any outliers in the data . What criteria did you use to identify outliers?arrow_forward
arrow_back_ios
SEE MORE QUESTIONS
arrow_forward_ios
Recommended textbooks for you
 MATLAB: An Introduction with ApplicationsStatisticsISBN:9781119256830Author:Amos GilatPublisher:John Wiley & Sons Inc
 Probability and Statistics for Engineering and th...StatisticsISBN:9781305251809Author:Jay L. DevorePublisher:Cengage Learning
 Statistics for The Behavioral Sciences (MindTap C...StatisticsISBN:9781305504912Author:Frederick J Gravetter, Larry B. WallnauPublisher:Cengage Learning
 Elementary Statistics: Picturing the World (7th E...StatisticsISBN:9780134683416Author:Ron Larson, Betsy FarberPublisher:PEARSON
 The Basic Practice of StatisticsStatisticsISBN:9781319042578Author:David S. Moore, William I. Notz, Michael A. FlignerPublisher:W. H. Freeman
 Introduction to the Practice of StatisticsStatisticsISBN:9781319013387Author:David S. Moore, George P. McCabe, Bruce A. CraigPublisher:W. H. Freeman

MATLAB: An Introduction with Applications
Statistics
ISBN:9781119256830
Author:Amos Gilat
Publisher:John Wiley & Sons Inc

Probability and Statistics for Engineering and th...
Statistics
ISBN:9781305251809
Author:Jay L. Devore
Publisher:Cengage Learning

Statistics for The Behavioral Sciences (MindTap C...
Statistics
ISBN:9781305504912
Author:Frederick J Gravetter, Larry B. Wallnau
Publisher:Cengage Learning

Elementary Statistics: Picturing the World (7th E...
Statistics
ISBN:9780134683416
Author:Ron Larson, Betsy Farber
Publisher:PEARSON

The Basic Practice of Statistics
Statistics
ISBN:9781319042578
Author:David S. Moore, William I. Notz, Michael A. Fligner
Publisher:W. H. Freeman

Introduction to the Practice of Statistics
Statistics
ISBN:9781319013387
Author:David S. Moore, George P. McCabe, Bruce A. Craig
Publisher:W. H. Freeman