
MATLAB: An Introduction with Applications
6th Edition
ISBN: 9781119256830
Author: Amos Gilat
Publisher: John Wiley & Sons Inc
expand_more
expand_more
format_list_bulleted
Related questions
Question
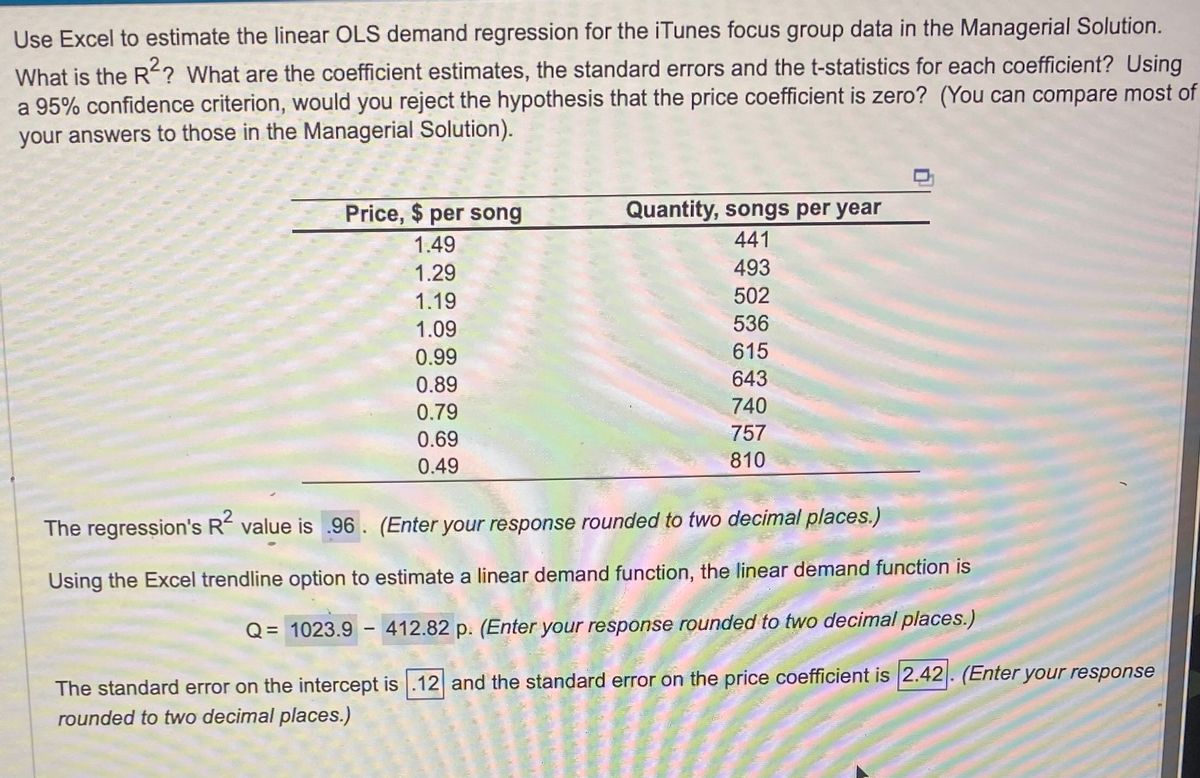

Transcribed Image Text:Use Excel to estimate the linear OLS demand regression for the iTunes focus group data in the Managerial Solution.
What is the R²? What are the coefficient estimates, the standard errors and the t-statistics for each coefficient? Using
a 95% confidence criterion, would you reject the hypothesis that the price coefficient is zero? (You can compare most of
your answers to those in the Managerial Solution).
Price, $ per song
1.49
1.29
1.19
1.09
0.99
0.89
0.79
0.69
0.49
Quantity, songs per year
441
493
502
536
615
643
740
757
810
The regression's R² value is 96. (Enter your response rounded to two decimal places.)
Using the Excel trendline option to estimate a linear demand function, the linear demand function is
Q = 1023.9412.82 p. (Enter your response rounded to two decimal places.)
The standard error on the intercept is .12 and the standard error on the price coefficient is 2.42. (Enter your response
rounded to two decimal places.)
Expert Solution
This question has been solved!
Explore an expertly crafted, step-by-step solution for a thorough understanding of key concepts.

This is a popular solution

Trending nowThis is a popular solution!

Step by stepSolved in 3 steps with 2 images

Knowledge Booster

Similar questions
- You have the following two data points for a process undergoing learning: Y3 = 50 and Y7 = 35 What is the best equation to use for prediction? Group of answer choices Yx = 84.2 x-0.2324 Yx = 77.6 x-0.5323 Yx = 79.4 x-0.4210 Yx = 80.7 x-0.3365 insufficient informationarrow_forwardYou need to use Stata to look up the dataset and its variables. Use Stata Companion Textbook. (Dataset: NES. Variables: spend8, [pw=nesw].) The NES dataset contains spend8, which records the number of government policy areas where respondents think spending should be increased. Scores range from 0 (the respondent does not want to increase spending on any of the policies) to 8 (the respondent wants to increase spending on all eight policies). The NES, of course, polls a random sample of U.S. adults. In this exercise you will analyze spend8 using the mean and lincom commands. You then will draw inferences about the population mean. (Remember to specify nesw as the probability weight.) The spend8 variable has a sample mean of ______. Make sure you use [pw=nesw] so your results are nationally representative. There is a probability of .95 that spend8’s true population mean falls between a score of ______ at the low end and a score of ______ at the high end. A student researcher…arrow_forwardDescribe in detail the results achieved on the company’s test. Ignore other variables for now, just describe the test results. If the company is considering training for the lowest 10% of employees what score would they need to achieve to be exempted from training? Test Result 163 148 142 173 168 155 163 194 119 124 149 171 160 104 165 154 122 160 148 138 158 112 189 163 203 165 176 152 74 129 166 134 124 169 187 163 172 195 149 107 156 183 133 83 148 127 173 95 139 179 136 153 141 155 179 152 129 155 145 113 142 147 171 139 174 143 96 199 143 172 123 146 128 187 138 163 178 154 199 164 123 201 205 135 123 138 195 184 165 196 154 176 82 173 156 149 152 116 174 141 111 74 123 182 157 141 167 162 172 107 149 182 112 135 177 159 138 163 148 198…arrow_forward
- Using the same data and information. Please answer this: Should you be encouraging or discouraging credit card sales? In answering this question, consider the following: Is the proportion of credit and non-credit sales significantly different? (a=.05) Is the average sale amount for credit sales different than the average sales amount for non-credit sales? (a=.05)arrow_forwardA recent study evaluated how addicted teenagers become to nicotine once they start smoking. The response variable was the number of yes answers on a questionnaire called the Hooked on Nicotine Checklist (HONC). Of teenagers who had tried tobacco, the mean HONC score was 4.2 (s = 5.4) for the 149 females and 2.8 (s=4.2) for the 190 males. Complete parts a through c below. 000 DOD F4 What does the standard error indicate? A. The standard error describes the spread of the sampling distribution of x₁ - x₂. B. The standard error is the standard deviation of the difference between x₁ - x₂. OC. The standard error is the standard deviation of the sample for this study. OD. The standard error is the difference in standard deviations for the two populations. ... b. Find the test statistic and P-value for Ho: H₁ H₂ and Ha: H₁ H₂. Interpret, and explain what (if any) effect gender has on the mean HONC score. Use the significance level 0.05. The test statistic is (Round to two decimal places as…arrow_forwardB - Does there appear to be a relationship between income and sadness, hopelessness, and worthlessness? justify your answer in your own word. points Figure 2. Feelings of Worthlessness. Hopelessness, and Sadness All or Most of the Time, by Income. 2011 Percentage of adults 4.6% 3.8% Less than $35.000 3.2% Sadness 2,3% 1.9% $35.000-49.999 Hopelessness 2.3% 1.5% 1.1% $50,000-74,999 Annual family income Worthlessness 1.3% 0.6% 0.6% $75,000-99,999 1.2% 0.5% 0.6% $100,000 or morearrow_forward
- Please anwser using SPSS!arrow_forward2 part question done in Excel. 1. Data are collected in a clinical trial evaluating a new compound designed to improve wound healing in trauma patients. The new compound is compared against a placebo. After treatment for 5 days with the new compound or placebo, the extent of the wound healing is measured and the date are show in the table below. Is there a difference in the extent of wound healing by treatment (Hint: Are treatment and the percent wound healing independent?) Run the appropriate tes at a 5% level of significance. 2. Use the data in Problem 1 and pool the data across the treatments into one sample of size n=250. Use the pooled data to test whether the distribution of the percent wound healing is approximately normal. Specifically, use the following distributions: 30%, 40%, 20%, and 10%. Run the appropriate test at a = 0.05.arrow_forwardDoctors are testing a new antidepressant. A group of patients, all with similar characteristics, take part in the study. Some of the patients receive the new drug, while others receive the traditional drug. The data are shown in the contingency table below. What is the relative risk of insomnia for those who receive the new drug? Round to two decimal places. Insomnia New drug- 52. No insomnia-226—total=278 Traditional drug-36. 295—331(total) Total- 88. 521. ( no insomnia)—— total-609arrow_forward
arrow_back_ios
arrow_forward_ios
Recommended textbooks for you
- MATLAB: An Introduction with ApplicationsStatisticsISBN:9781119256830Author:Amos GilatPublisher:John Wiley & Sons Inc
 Probability and Statistics for Engineering and th...StatisticsISBN:9781305251809Author:Jay L. DevorePublisher:Cengage Learning
 Statistics for The Behavioral Sciences (MindTap C...StatisticsISBN:9781305504912Author:Frederick J Gravetter, Larry B. WallnauPublisher:Cengage Learning
  Elementary Statistics: Picturing the World (7th E...StatisticsISBN:9780134683416Author:Ron Larson, Betsy FarberPublisher:PEARSON
 The Basic Practice of StatisticsStatisticsISBN:9781319042578Author:David S. Moore, William I. Notz, Michael A. FlignerPublisher:W. H. Freeman
 Introduction to the Practice of StatisticsStatisticsISBN:9781319013387Author:David S. Moore, George P. McCabe, Bruce A. CraigPublisher:W. H. Freeman
MATLAB: An Introduction with Applications
Statistics
ISBN:9781119256830
Author:Amos Gilat
Publisher:John Wiley & Sons Inc
Probability and Statistics for Engineering and th...
Statistics
ISBN:9781305251809
Author:Jay L. Devore
Publisher:Cengage Learning
Statistics for The Behavioral Sciences (MindTap C...
Statistics
ISBN:9781305504912
Author:Frederick J Gravetter, Larry B. Wallnau
Publisher:Cengage Learning
Elementary Statistics: Picturing the World (7th E...
Statistics
ISBN:9780134683416
Author:Ron Larson, Betsy Farber
Publisher:PEARSON
The Basic Practice of Statistics
Statistics
ISBN:9781319042578
Author:David S. Moore, William I. Notz, Michael A. Fligner
Publisher:W. H. Freeman
Introduction to the Practice of Statistics
Statistics
ISBN:9781319013387
Author:David S. Moore, George P. McCabe, Bruce A. Craig
Publisher:W. H. Freeman