
MATLAB: An Introduction with Applications
6th Edition
ISBN: 9781119256830
Author: Amos Gilat
Publisher: John Wiley & Sons Inc
expand_more
expand_more
format_list_bulleted
Related questions
Question
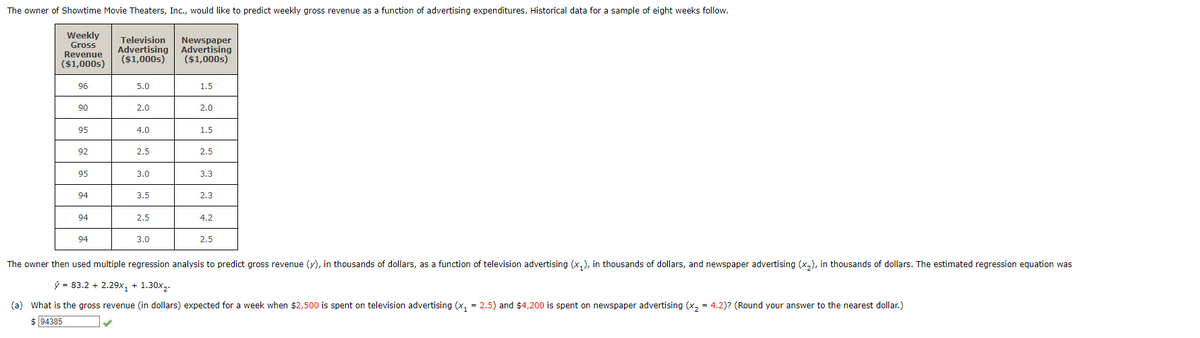

Transcribed Image Text:The owner of Showtime Movie Theaters, Inc., would like to predict weekly gross revenue as a function of advertising expenditures. Historical data for a sample of eight weeks follow.
Weekly
Gross
Revenue
($1,000s)
Television Newspaper
Advertising Advertising
($1,000s) ($1,000s)
96
5.0
1.5
90
2.0
2.0
95
4.0
1.5
92
2.5
2.5
95
3.0
3.3
94
3.5
2.3
94
2.5
4.2
94
3.0
2.5
The owner then used multiple regression analysis to predict gross revenue (y), in thousands of dollars, as a function of television advertising (x₁), in thousands of dollars, and newspaper advertising (x2), in thousands of dollars. The estimated regression equation was
ŷ = 83.2 + 2.29x₁ + 1.30x2.
(a) What is the gross revenue (in dollars) expected for a week when $2,500 is spent on television advertising (x₁ = 2.5) and $4,200 is spent on newspaper advertising (x2 = 4.2)? (Round your answer to the nearest dollar.)
$ 94385
Expert Solution
This question has been solved!
Explore an expertly crafted, step-by-step solution for a thorough understanding of key concepts.

This is a popular solution

Trending nowThis is a popular solution!

Step by stepSolved in 1 steps

Knowledge Booster

Similar questions
- Using the information in the screenshot, can you please calculate the measures of spreadarrow_forwardDetermine whether the data is from a primary or secondary source. Primary Secondaryarrow_forwardThe decrease in cholesterol level (in mg/dL) for ten individuals are listed below. Calculate the range of the data. 16 22 17 18 22 19 21 20 18 23arrow_forward
- Analyze: write an analysis of the relative frequency table. Female Male Total Agree 0.32 0.32 0.64 Disagree 0.16 0.2 0.36 Total 0.48 0.34 1arrow_forwardII On Friday night, the owner of Chez Pierre in downtown Chicago noted the amount spent for dinner for 28 four-person tables. 95 103 109 114 113 107 10 OLT 104 08 134 124 105 84 176 115 69 68 95 108 61 091 87 128 95 61 150 52 136 E Click here for the Excel Data File (a) Find the mean, median, and mode. (Round your answers to 2 decimal places.) Descriptive Statistics Data Count Mean Median Mode (b) Are the data symmetric or skewed? If skewed, which direction? O Symmetric O Skewed left O Skewed right Graw 11!H < Prev 10 of 19 ....... 2 Type here to search < įXƏNarrow_forwardExplain the meaning of the specified term. Distribution of a data setarrow_forward
- Dixie Showtime Movie Theaters, Inc., owns and operates a chain of cinemas in several markets in the southern U.S. The owners would like to estimate weekly gross revenue as a function of advertising expenditures. Data for a sample of eight markets for a recent week follow. Market Mobile Shreveport Jackson Birmingham Little Rock Biloxi New Orleans Baton Rouge Weekly Gross Revenue Television Advertising Newspaper Advertising ($100s) 101.3 51.9 74.8 126.2 137.8 101.4 237.8 219.6 ($100s) 5.0 3.0 4.0 4.3 3.6 3.5 5.0 6.9 + (a) Use the data to develop an estimated regression equation with the amount of television advertising as the independent variable. Let x represent the amount of television advertising. If required, round your answers to three decimal places. For subtractive or negative numbers use a minus sign even if there is a + sign before the blank. (Example: -300) ŷ ($100s) 1.5 3.0 1.5 4.3 4.0 2.3 8.4 5.8 X Test for a significant relationship between television advertising and weekly…arrow_forwardPrisons 2006 A report from the U.S. Department ofJustice (www.ojp.usdoj.gov/bjs/) reported the percentchanges in federal prison populations in 21 northeasternand midwestern states during 2006. Using appropriategraphical displays and summary statistics, write a reporton the changes in prison populations.arrow_forwardThe owner of Showtime Movie Theaters, Inc. would like to predict weekly gross revenue as a function of advertising expenditures. Historical data for a sample of eight weeks follow. Weekly GrossRevenue($1000s) TelevisonAdvertising($1000s) NewspaperAdvertising($1000s) 96 5.0 1.5 90 2.0 2.0 95 4.0 1.5 92 2.5 2.5 95 3.0 3.3 94 3.5 2.3 94 2.5 4.2 94 3.0 2.5 Part A: Develop an estimated regression equation with the amount of television advertising as the independent variable. Part B: Develop an estimated regression equation with both television advertising and news paper advertising as independent variables. Part C: Is the estimated regression rquation coefficient for television advertising expenditures the same in part (a) and in part (b) ? Interpret the coefficient in each case. Part D : Predict Weekly gross revenue for a week $3500 is spent on television advertising and $1800 is spent on newspaper advertising? Please hurryarrow_forward
- Explain the meaning of the specified term. Sample dataarrow_forwardResearchers wondered whether the size of a person's brain was related to the individual's mental capacity. They selected a sample of 5 females and 5 males and measured their MRI image pixel counts and IQ scores. Females Males MRI IQ MRI IG The data is reported to the right. Complete parts (a) through (d) below 139 858,472 140 955,003 935,494 924,059 1.079.550 1,001.121 Click the icon to view the critical values table. 991,305 138 141 857,782 833,868 790,619 133 135 132 141 135 140 AMRI 1,080,000- AIO 145 AIO 145- AMRI 1,080,000 780,000 130 130 780,000 130 780,000 780,000 130 1,080,000 145 1,080,000 MRI 145 MRI (b) Compute the linear correlation coefficient between MRI count and IQ. Are MRI count and IQ linearly related? Select the correct choice below and, if necessary, fill in the answer box to complete your choice. (Round to three decimal places as needed.) A. Yes, MRI count and IQ are linearly related since the linear correlation coefficient is O B. No. MRI count and IQ are not…arrow_forwardTop-Paid CEOs The data shown are the total compensation (in millions of dollars) for the 27 top-paid CEOs for a recent year. Compare the averages, and state which one you think is the best measure. 미 00 18.0 18.0 18.2 19.1 19.1 19.3 19.7 19.8 21.6 22.9 23.2 23.7 24.0 24.0 24.1 25.1 25.2 25.2 25.4 25.5 25.9 26.8 31.7 35.2 35.4 36.8 38.5 Send data to Excel Part: 0 / 5 Part 1 of 5 Find the mean. Rounding rule for the mean: round to one more decimal place than the data as needed. Mean: illoarrow_forward
arrow_back_ios
SEE MORE QUESTIONS
arrow_forward_ios
Recommended textbooks for you
- MATLAB: An Introduction with ApplicationsStatisticsISBN:9781119256830Author:Amos GilatPublisher:John Wiley & Sons Inc
 Probability and Statistics for Engineering and th...StatisticsISBN:9781305251809Author:Jay L. DevorePublisher:Cengage Learning
 Statistics for The Behavioral Sciences (MindTap C...StatisticsISBN:9781305504912Author:Frederick J Gravetter, Larry B. WallnauPublisher:Cengage Learning
  Elementary Statistics: Picturing the World (7th E...StatisticsISBN:9780134683416Author:Ron Larson, Betsy FarberPublisher:PEARSON
 The Basic Practice of StatisticsStatisticsISBN:9781319042578Author:David S. Moore, William I. Notz, Michael A. FlignerPublisher:W. H. Freeman
 Introduction to the Practice of StatisticsStatisticsISBN:9781319013387Author:David S. Moore, George P. McCabe, Bruce A. CraigPublisher:W. H. Freeman
MATLAB: An Introduction with Applications
Statistics
ISBN:9781119256830
Author:Amos Gilat
Publisher:John Wiley & Sons Inc
Probability and Statistics for Engineering and th...
Statistics
ISBN:9781305251809
Author:Jay L. Devore
Publisher:Cengage Learning
Statistics for The Behavioral Sciences (MindTap C...
Statistics
ISBN:9781305504912
Author:Frederick J Gravetter, Larry B. Wallnau
Publisher:Cengage Learning
Elementary Statistics: Picturing the World (7th E...
Statistics
ISBN:9780134683416
Author:Ron Larson, Betsy Farber
Publisher:PEARSON
The Basic Practice of Statistics
Statistics
ISBN:9781319042578
Author:David S. Moore, William I. Notz, Michael A. Fligner
Publisher:W. H. Freeman
Introduction to the Practice of Statistics
Statistics
ISBN:9781319013387
Author:David S. Moore, George P. McCabe, Bruce A. Craig
Publisher:W. H. Freeman