
ENGR.ECONOMIC ANALYSIS
14th Edition
ISBN: 9780190931919
Author: NEWNAN
Publisher: Oxford University Press
expand_more
expand_more
format_list_bulleted
Related questions
Question
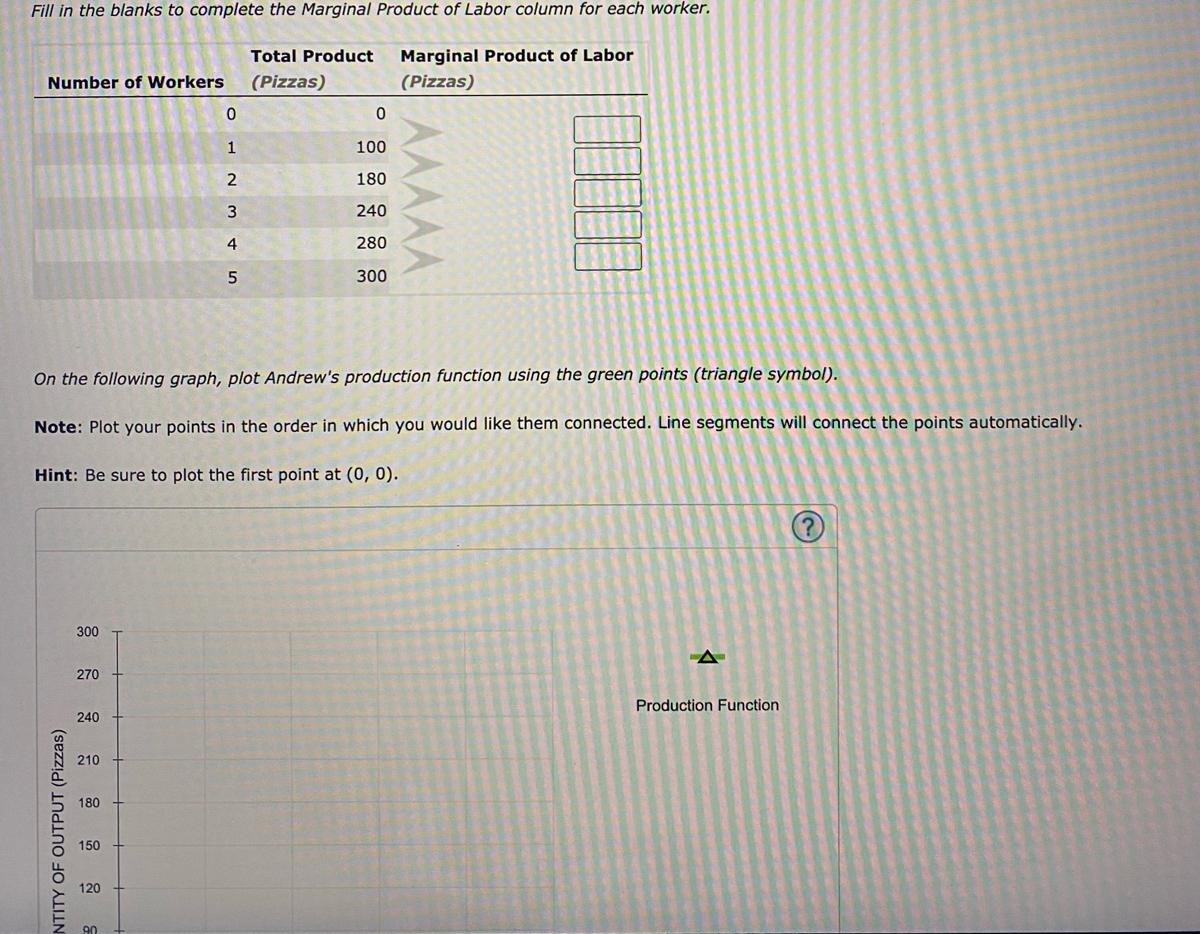

Transcribed Image Text:Fill in the blanks to complete the Marginal Product of Labor column for each worker.
Total Product
Marginal Product of Labor
Number of Workers
(Pizzas)
(Pizzas)
1
100
2
180
240
4
280
300
On the following graph, plot Andrew's production function using the green points (triangle symbol).
Note: Plot your points in the order in which you would like them connected. Line segments will connect the points automatically.
Hint: Be sure to plot the first point at (0, 0).
300
270
Production Function
240
210
180
150
120
90
NTITY OF OUTPUT (Pizzas)

Transcribed Image Text:Use the orange points (square symbol) to plot Andrew's total cost curve on the following graph using the quantities from the preceding
300
270
Total Cost
240
210
180
150
90
60
30
30
60
90
120
150
180
210
240
270 300
QUANTITY OF OUTPUT (Pizzas)
True or False: The shape of the production function reflects the law of increasing marginal returns.
True
O False
TOTAL COST (Dollars)
Expert Solution
This question has been solved!
Explore an expertly crafted, step-by-step solution for a thorough understanding of key concepts.

This is a popular solution

Trending nowThis is a popular solution!

Step by stepSolved in 2 steps with 1 images

Knowledge Booster

Similar questions
- /arrow_forward5. A company that produces auto parts has a production function of Q = 300 L-75 K-5. %3D If L= 250 and K= 25, what is the output of auto parts? If L increases to 350, what is the output of auto parts? What does the change in output show regarding labor as a factor of production?arrow_forwardRefer to the table below. The average product when three workers are employed is: Number of workers Total output 1 3 2 8 3 15 4 21 5 26 6 28 7 29 8 29 9 27 A). 3. B). 4. C). 5. D). 6.arrow_forward
- ASAP!! ANSWER PLEASE Hammas Dadani operates a business and uses the following table for total output or total product as a function of labor units used. LABOR TOTAL OUTPUT 0 0 1 5 2 9 3 12 4 14 5 15 Calculate Marginal Product of Labor and Average Product of Labor? Plot a graph for total product, marginal product and average product separately? Does the graph indicate a situation of diminishing returns? Explain your answer.arrow_forwardSubpart 1-3arrow_forwardMaria produces pizzas using labor, an oven, and flour. When Maria uses 4 workers she can produce 100 pizzas per day. When she uses 8 workers, she can produce 175 pizzas per day. True or false: Maria's production function displays decreasing returns to scale. True or Falsearrow_forward
- Suppose that production function of certain devices is determined by: q = k * L - 0.8 k2 - 0.2 L2 Where q represents annual quantity of devices produced, k represents annual quantity of capital factor, and L represents annual quantity of labor factor. (a) Suppose k = 10; draw a graph with average and total labor productivity. What is level of labor (L) factor at which average productivity reaches a maximum? How many devices are produced at that point? (b) Assuming again that k = 10, plot Marginal Product (MP) curve. At what level do we have that labor (L) factor is MP = 0? (c) Suppose capital (k) factor were to increase to k = 20. How would your previous answers change?arrow_forwardIm so confused what I am doing wrong I need help.arrow_forward
arrow_back_ios
arrow_forward_ios
Recommended textbooks for you
 Principles of Economics (12th Edition)EconomicsISBN:9780134078779Author:Karl E. Case, Ray C. Fair, Sharon E. OsterPublisher:PEARSON
 Engineering Economy (17th Edition)EconomicsISBN:9780134870069Author:William G. Sullivan, Elin M. Wicks, C. Patrick KoellingPublisher:PEARSON
 Principles of Economics (MindTap Course List)EconomicsISBN:9781305585126Author:N. Gregory MankiwPublisher:Cengage Learning
 Managerial Economics: A Problem Solving ApproachEconomicsISBN:9781337106665Author:Luke M. Froeb, Brian T. McCann, Michael R. Ward, Mike ShorPublisher:Cengage Learning
 Managerial Economics & Business Strategy (Mcgraw-...EconomicsISBN:9781259290619Author:Michael Baye, Jeff PrincePublisher:McGraw-Hill Education
Principles of Economics (12th Edition)
Economics
ISBN:9780134078779
Author:Karl E. Case, Ray C. Fair, Sharon E. Oster
Publisher:PEARSON
Engineering Economy (17th Edition)
Economics
ISBN:9780134870069
Author:William G. Sullivan, Elin M. Wicks, C. Patrick Koelling
Publisher:PEARSON
Principles of Economics (MindTap Course List)
Economics
ISBN:9781305585126
Author:N. Gregory Mankiw
Publisher:Cengage Learning
Managerial Economics: A Problem Solving Approach
Economics
ISBN:9781337106665
Author:Luke M. Froeb, Brian T. McCann, Michael R. Ward, Mike Shor
Publisher:Cengage Learning
Managerial Economics & Business Strategy (Mcgraw-...
Economics
ISBN:9781259290619
Author:Michael Baye, Jeff Prince
Publisher:McGraw-Hill Education