
ENGR.ECONOMIC ANALYSIS
14th Edition
ISBN: 9780190931919
Author: NEWNAN
Publisher: Oxford University Press
expand_more
expand_more
format_list_bulleted
Related questions
Question
Questions 4 & 5
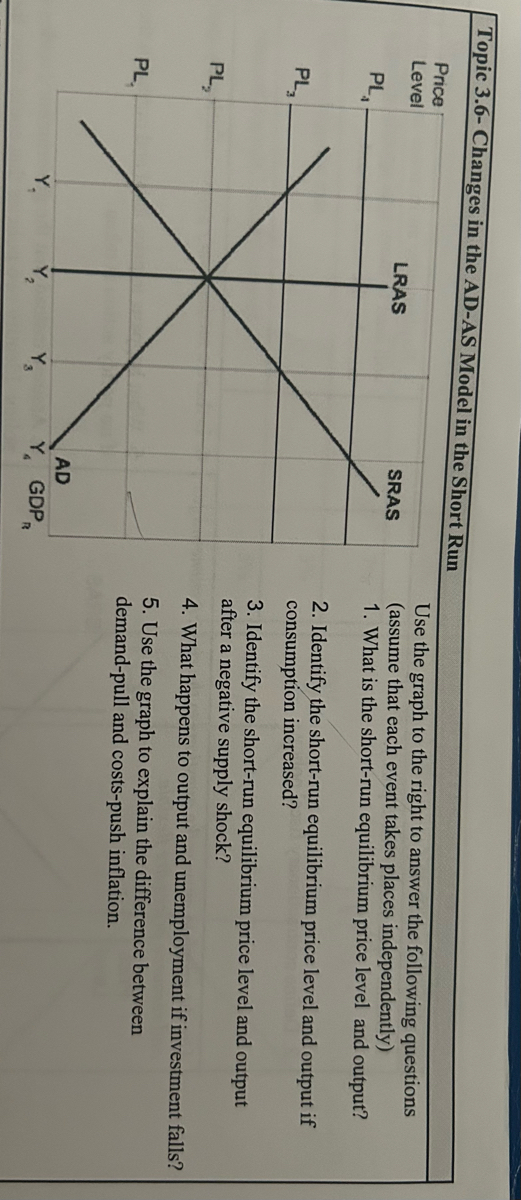

Transcribed Image Text:# Topic 3.6: Changes in the AD-AS Model in the Short Run
## Graph Description
The image shows a graph depicting the Aggregate Demand (AD) and Aggregate Supply (AS) model in the short run. The graph is essential in understanding the impacts of various economic shifts on price levels and output (GDP).
### Graph Elements:
- **Axes**:
- The vertical axis represents the Price Level, labeled with points PL1, PL2, PL3, and PL4.
- The horizontal axis represents GDP, marked with outputs Y1, Y2, Y3, and Yf (full employment output).
- **Curves**:
- **AD Curve**: Downward sloping, represents Aggregate Demand.
- **SRAS (Short-Run Aggregate Supply) Curve**: Upward sloping, represents Short-Run Aggregate Supply.
- **LRAS (Long-Run Aggregate Supply) Line**: Vertical, represents the economy's full employment output.
## Questions
Use the graph to the right to answer the following questions (assume that each event takes place independently):
1. What is the short-run equilibrium price level and output?
2. Identify the short-run equilibrium price level and output if consumption increased.
3. Identify the short-run equilibrium price level and output after a negative supply shock.
4. What happens to output and unemployment if investment falls?
5. Use the graph to explain the difference between demand-pull and cost-push inflation.
Expert Solution
This question has been solved!
Explore an expertly crafted, step-by-step solution for a thorough understanding of key concepts.

This is a popular solution

Trending nowThis is a popular solution!

Step by stepSolved in 4 steps with 3 images

Knowledge Booster


Learn more about
Need a deep-dive on the concept behind this application? Look no further. Learn more about this topic, economics and related others by exploring similar questions and additional content below.Similar questions
- Each term (3 months) the current group of economics students completed a questionnaire as to how much they would spend on new purchases compared to how much they would save/pay off bills, if they suddenly and unexpectedly received a check for $1,000. The average MPC is shown in the table below. Month in which student poll was taken Average of students’ responses as MPC March 0.41 June 0.30 September 0.22 December 0.56 What do these MPC’s imply about the students’ thinking over the course of the year? (Enter response here.) What is likely happening in the economy during the same period of time?arrow_forwardResults Real Estate had 6 home sales during the week: $150,000, $140,000, $240,000, $158,000, $3,200,000, and $150,000. What is the mode?arrow_forwardCompany X is going to buy a total of 4 ads. They are going to advertise in the newspaper or on the radio. The more ads they buy the more customers they have based on the following schedule. Number of Ads Total new customers from newspaper ads Total new customers from radio ads 0 0 0 1 100 200 2 180 320 3 220 390 4 240 400 In this case, the best strategy is to buy newspaper ads and radio ads. Enter whole numbers.arrow_forward
- Figure 1 P 100 70 60 50 20 30 40 S D Qarrow_forwardSuppose you are shopping online for a new toy for your dog. As you look at the product reviews, you see the following distribution of ratings. Use this table for questions 2-5. Stars 5 4 3 st 2 IN 1 Frequency 9 3 2 1 5arrow_forwardWrite down the name of the sections of the report. (a) What questions are answered in each section? Write one specific question and one general question for each section.arrow_forward
- In the late 1980s land prices in Japan surged upward in a speculative bubble. Land prices then fell for 11 straight years between 1990 and 2001. What can we safely assume happened to land rent in Japan over those 11 years? Use graphical analysis to illustrate your answer. graphical analysis is must, you have to draw graph. Do not provide handwritten solution. Maintain accuracy and quality in your answer. Take care of plagiarism. Answer completely. You will get up vote for sure.arrow_forward24arrow_forwardI just went to check my answers for question 4 and 5 on the homework. These questions are based off of the other questions 1-3 that I have already answered. I have answer 4 and 5 but not sure if they are right. I have attached all questions.arrow_forward
arrow_back_ios
arrow_forward_ios
Recommended textbooks for you
 Principles of Economics (12th Edition)EconomicsISBN:9780134078779Author:Karl E. Case, Ray C. Fair, Sharon E. OsterPublisher:PEARSON
 Engineering Economy (17th Edition)EconomicsISBN:9780134870069Author:William G. Sullivan, Elin M. Wicks, C. Patrick KoellingPublisher:PEARSON
 Principles of Economics (MindTap Course List)EconomicsISBN:9781305585126Author:N. Gregory MankiwPublisher:Cengage Learning
 Managerial Economics: A Problem Solving ApproachEconomicsISBN:9781337106665Author:Luke M. Froeb, Brian T. McCann, Michael R. Ward, Mike ShorPublisher:Cengage Learning
 Managerial Economics & Business Strategy (Mcgraw-...EconomicsISBN:9781259290619Author:Michael Baye, Jeff PrincePublisher:McGraw-Hill Education
Principles of Economics (12th Edition)
Economics
ISBN:9780134078779
Author:Karl E. Case, Ray C. Fair, Sharon E. Oster
Publisher:PEARSON
Engineering Economy (17th Edition)
Economics
ISBN:9780134870069
Author:William G. Sullivan, Elin M. Wicks, C. Patrick Koelling
Publisher:PEARSON
Principles of Economics (MindTap Course List)
Economics
ISBN:9781305585126
Author:N. Gregory Mankiw
Publisher:Cengage Learning
Managerial Economics: A Problem Solving Approach
Economics
ISBN:9781337106665
Author:Luke M. Froeb, Brian T. McCann, Michael R. Ward, Mike Shor
Publisher:Cengage Learning
Managerial Economics & Business Strategy (Mcgraw-...
Economics
ISBN:9781259290619
Author:Michael Baye, Jeff Prince
Publisher:McGraw-Hill Education