
A First Course in Probability (10th Edition)
10th Edition
ISBN: 9780134753119
Author: Sheldon Ross
Publisher: PEARSON
expand_more
expand_more
format_list_bulleted
Related questions
Question
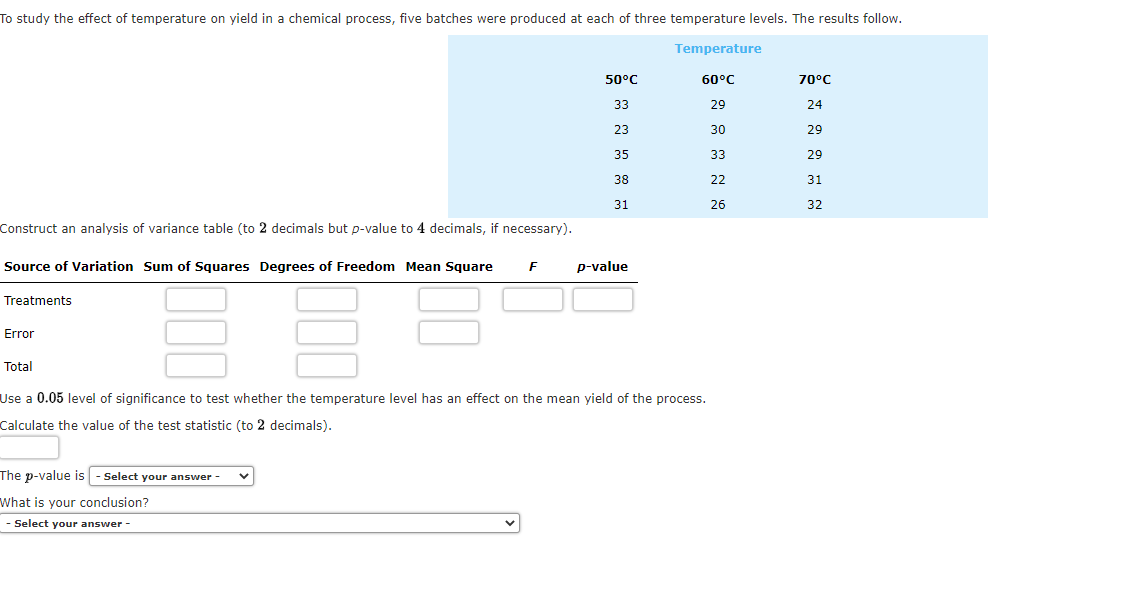

Transcribed Image Text:To study the effect of temperature on yield in a chemical process, five batches were produced at each of three temperature levels. The results follow.
Temperature
50°C
60°C
70°C
33
29
24
23
30
29
35
33
29
38
22
31
31
26
32
Construct an analysis of variance table (to 2 decimals but p-value to 4 decimals, if necessary).
Source of Variation Sum of Squares Degrees of Freedom Mean Square
p-value
Treatments
Error
Total
Use a 0.05 level of significance to test whether the temperature level has an effect on the mean yield of the process.
Calculate the value of the test statistic (to 2 decimals).
The p-value is - Select your answer -
What is your conclusion?
- Select your answer -
Expert Solution
This question has been solved!
Explore an expertly crafted, step-by-step solution for a thorough understanding of key concepts.

This is a popular solution

Trending nowThis is a popular solution!

Step by stepSolved in 3 steps

Knowledge Booster

Similar questions
- (c) Determine if the means of samples 1 and 2 overestimate, underestimate, or are equal to the population mean. The mean pulse rate of sample 1 the population mean. The mean pulse rate of sample 2 the population mean.arrow_forwardAssume the samples are random and independent, the populations are nomally distributed, and the population variances are equal. The table available below shows the prices (in dollars) for a sample of automobile batteries. The prices are classified according to battery type. At a = 0.10, is there enough evidence conclude that at least one mean battery price is different from the others? Complete parts (a) through (e) below. E Click the icon to view the battery cost data. (a) Let u1. P2. H3 represent the mean prices for the group size 35, 65, and 24/24F respectively. Identify the claim and state Ho and H. H Cost of batteries by type The claim is the V hypothesis. Group size 35 Group size 65 Group size 24/24F 101 111 121 124 D 146 173 182 278 124 140 141 89 (b) Find the critical value, Fo, and identify the rejection region. 90 79 84 The rejection region is F Fo, where Fo = (Round to two decimal places as needed.) (c) Find the test statistic F. Print Done F= (Round to two decimal places as…arrow_forwardFind the mean, the median, and all modes for the data in the given frequency distribution. (Round your answers to one decimal place. If there is more than one mode, enter your answer as a comma-separated list. If an answer does not exist, enter DNE.) mean median mode(s) Points Scored by Lynn Points scored in abasketball game Frequency 2 9 6 8 7 9 10 7 11 2 13 4 14 2arrow_forward
- Statistics students believe that the mean score on a first statistics test is 65. The instructor thinks that the mean score is higher. She samples 10 statistics students and obtains the scores: Grades 73.5 88 63.9 85.5 62.7 65 83.2 61.9 88 62.7 Test grades are believed to be normally distributed.Use a significance level of 5%. State the alternative hypothesis: HA:HA: μ>65μ>65 μ<65μ<65 μ≠65μ≠65 State the mean of the sample: State the standard error of the sample means: State the test statistic: t=t= State the p-value: Decision: Fail to reject the null hypothesis. Reject the null hypothesis.arrow_forwardCalculate the variance of the following data assume sample data: YOU MUST USE TWO DECIMAL PLACES FOR THE MEAN THROUGHOUT YOUR CALCULATION Tigers Frequency 1 4 9 8 CO 13 8 CO 17 21 10 9 ANSWER INSTRUCTION: Round your answer to two decimal places then enter them in the answer box.arrow_forwardFind the mean, the median, and all modes for the data in the given frequency distribution. (Round your answers to one decimal place. If there is more than one mode, enter your answer as a comma-separated list. If an answer does not exist, enter DNE.) mean median mode(s) Points Scored by Lynn Points scored in abasketball game Frequency 2 8 8 5 9 8 13 4 14 1 18 3 21 1arrow_forward
arrow_back_ios
arrow_forward_ios
Recommended textbooks for you
- A First Course in Probability (10th Edition)ProbabilityISBN:9780134753119Author:Sheldon RossPublisher:PEARSON

A First Course in Probability (10th Edition)
Probability
ISBN:9780134753119
Author:Sheldon Ross
Publisher:PEARSON