
Practical Management Science
6th Edition
ISBN: 9781337406659
Author: WINSTON, Wayne L.
Publisher: Cengage,
expand_more
expand_more
format_list_bulleted
Related questions
Concept explainers
Question
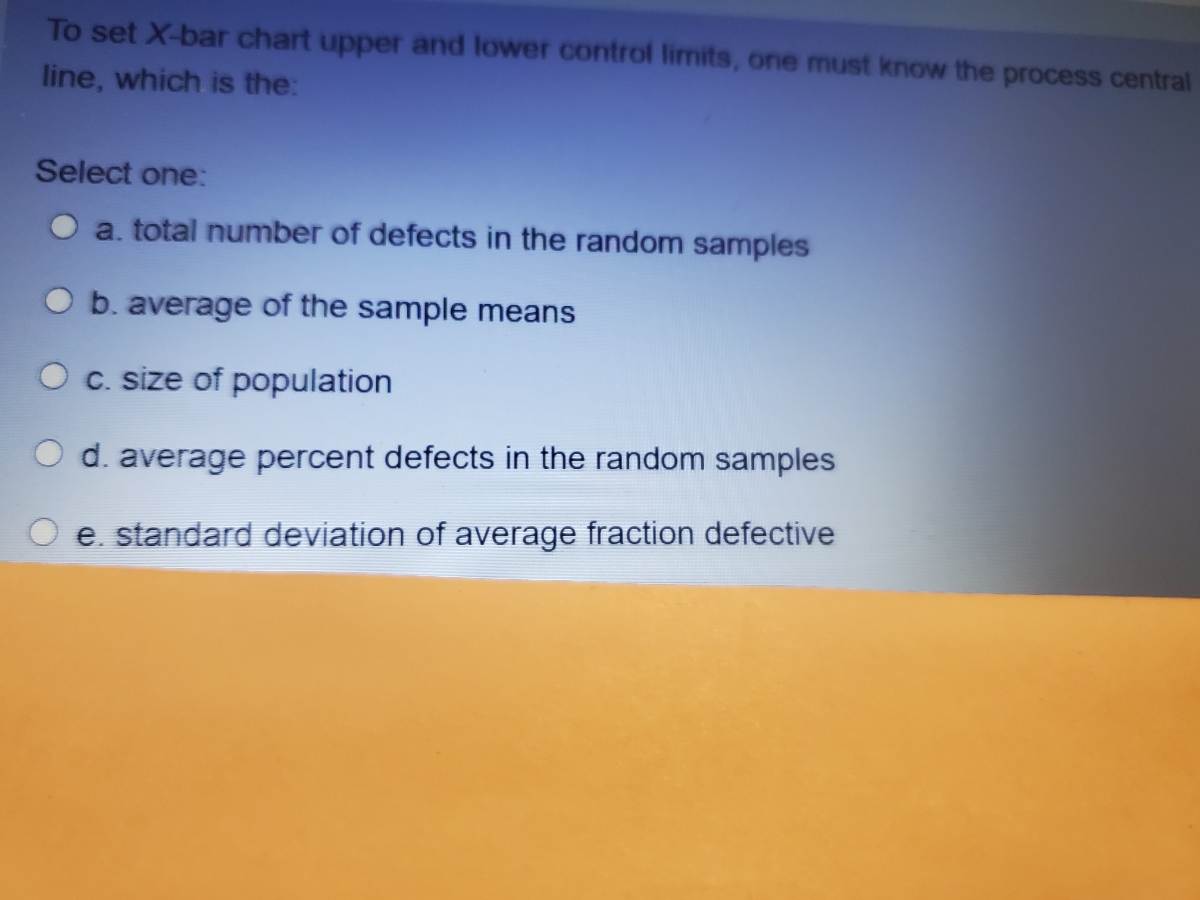

Transcribed Image Text:To set X-bar chart upper and lower control limits, one must know the process central
line, which is the:
Select one:
a. total number of defects in the random samples
b. average of the sample means
C. size of population
d. average percent defects in the random
mples
e. standard deviation of average fraction defective
Expert Solution
This question has been solved!
Explore an expertly crafted, step-by-step solution for a thorough understanding of key concepts.

This is a popular solution

Trending nowThis is a popular solution!

Step by stepSolved in 2 steps

Knowledge Booster


Learn more about
Need a deep-dive on the concept behind this application? Look no further. Learn more about this topic, operations-management and related others by exploring similar questions and additional content below.Similar questions
- 8. Averaging techniques are useful for: A. distinguishing between random and non-random variations B. smoothing out fluctuations in time series C. eliminating historical data D. providing accuracy in forecasts E. average peoplearrow_forward4. Cartons of Plaster of Paris are supposed to weigh exactly 32 oz. Inspectors want to develop process control charts. They take 5 samples of 6 boxes per sample and weigh them. Based on the following data, what are the lower and upper control limits for the 3-sigma mean chart and the range chart, respectively? Please keep two decimal places and select the best answers. Select one: a. [33.8, 34.76], [0, 2.00] b. [33.96, 34.60], [0, 1.18] c. [34.01, 34.55], [0, 1.12] d. [34.01, 34.55], [0.52, 2.52] e. [32.6, 35.96], [0, 1.12]arrow_forward10. To monitor the quality of pepperoni pizzas, a quality control manager collects random samples of pizzas and evaluates them. The process mean and standard deviation for the weight and diameter of pizzas are not known. Which of the following(s) is a correct matching between the type of data collected and the choice of control chart used? Select all correct matchings. Select one: a. The manager weighed the sampled pizzas and constructed a c-chart. b. The manager rated the appearance of sampled pizzas as acceptable or unacceptable and then constructed a c-chart. c. The manager counted the number of pepperonis per each inspected pizza and constructed a mean chart. d. The manager measured the diameter of the sampled pizzas and constructed a range chart.arrow_forward
- The specification limits for a product are 9.9 cm and 12.35 cm. A process that produces the product has a mean of 11.18 cm and a standard deviation of 0.52 cm. What is the process capability, Cpk? a. 0.8205 b. 1.571 c. 0.7853 d. 0.75arrow_forwardBoxes of Honey-Nut Oatmeal are produced to contain 14.0 ounces, with a standard deviation of 0.10 ounce. For a sample size of 49, the 3-sigma x chart control limits are: Upper Control Limit (UCL) = Lower Control Limit (LCL) = ounces (round your response to two decimal places). ounces (round your response to two decimal places).arrow_forwardPlease do not give solution in image format thankuarrow_forward
- A quality inspector took five samples in five hours, each with four observations, of the length time for glue to dry. The analyst compute the mean of each sample and the computed the grand mean. All values are in minutes. Use this information to obtain three-sigma control limits for means. It is known from previous experience that the standard deviation of the process is 0.02 minutes. Draw a control chart Please provide a step-by-step solutionarrow_forwardAspen Plastics produces plastic bottles to customer order.The quality inspector randomly selects four bottles fromthe bottle machine and measures the outside diameter ofthe bottle neck, a critical quality dimension that determineswhether the bottle cap will fit properly. The dimensions(inch) from the last six samples are Assume that only these six samples are sufficient, and use thedata to determine control limits for an R- and an x-chart.arrow_forwardLay's potato chip filling process has a lower specification limit of 9.5 oz. and an upper specification of 10.5 oz. The mean is 10 oz. What should be the value for standard deviation in this process to achieve a ppm of 5110? A. 0.1786 B. 0.2675 OC. 0.4453 OD. 0.3564arrow_forward
- Twenty samples of 100 items each were inspected when a process was considered to be operating satisfactorily. In the 20 samples, a total of 140 items were found to be defective. (a) What is an estimate of the proportion defective when the process is in control? (b) What is the standard error of the proportion if samples of size 100 will be used for statistical process control? (Round your answer to four decimal places.) (c) Compute the upper and lower control limits for the control chart. (Round your answers to four decimal places.) UCL = LCL =arrow_forwardThe defect rate for your product has historically been about 2.00%. For a sample size of 500, the upper and lower 3-sigma control chart limits are: UCL = (enter your response as a number between 0 and 1, rounded to four decimal places).arrow_forwardA shirt manufacturer buys clothes by the 100-yard roll from a supplier. For setting a control chart to manage the irregularities (e.g., loose threads and tears), the following data were collected from a sample provided by the supplier. Sample 1 2 3 4 5 6 7 8 9 10 Irregularities 3 5 2 6 5 4 6 3 4 5 Which type of control chart should be used? Construct a control chart with two-sigma control limits. Suppose the next five rolls from the supplier had three, two, five, three, and seven irregularities. Is the supplier process under control? Explain and show workarrow_forward
arrow_back_ios
SEE MORE QUESTIONS
arrow_forward_ios
Recommended textbooks for you
- Practical Management ScienceOperations ManagementISBN:9781337406659Author:WINSTON, Wayne L.Publisher:Cengage,
 Operations ManagementOperations ManagementISBN:9781259667473Author:William J StevensonPublisher:McGraw-Hill Education
 Operations and Supply Chain Management (Mcgraw-hi...Operations ManagementISBN:9781259666100Author:F. Robert Jacobs, Richard B ChasePublisher:McGraw-Hill Education
 Purchasing and Supply Chain ManagementOperations ManagementISBN:9781285869681Author:Robert M. Monczka, Robert B. Handfield, Larry C. Giunipero, James L. PattersonPublisher:Cengage Learning
 Production and Operations Analysis, Seventh Editi...Operations ManagementISBN:9781478623069Author:Steven Nahmias, Tava Lennon OlsenPublisher:Waveland Press, Inc.
Practical Management Science
Operations Management
ISBN:9781337406659
Author:WINSTON, Wayne L.
Publisher:Cengage,
Operations Management
Operations Management
ISBN:9781259667473
Author:William J Stevenson
Publisher:McGraw-Hill Education
Operations and Supply Chain Management (Mcgraw-hi...
Operations Management
ISBN:9781259666100
Author:F. Robert Jacobs, Richard B Chase
Publisher:McGraw-Hill Education
Purchasing and Supply Chain Management
Operations Management
ISBN:9781285869681
Author:Robert M. Monczka, Robert B. Handfield, Larry C. Giunipero, James L. Patterson
Publisher:Cengage Learning
Production and Operations Analysis, Seventh Editi...
Operations Management
ISBN:9781478623069
Author:Steven Nahmias, Tava Lennon Olsen
Publisher:Waveland Press, Inc.