
Related questions
Can someone please explain to me how to complete 3-sigma control limits (upper and Lower) using Excel?
This is the question I am trying to answer:
Thirty-five samples of size 7 each were taken from a fertilizer-bag-filling machine at Panos Kouvelis Lifelong Lawn Ltd. The results were: Overall mean = 57.75 lb., Average range R = 1.78 lb.
a) For the given
Upper Control Limit (UCL) = ____Ib (round your response to three decimal places)


Step by stepSolved in 3 steps with 2 images

HOW WOULD I CALCULATE THE UPPER/LOWER 3-SIGMA CONTROL LIMITS FOR R-CHART? HOW WOULD THAT CHANGE THE GIVEN FORMULA?
(UCLR) =_?__
HOW WOULD I CALCULATE THE UPPER/LOWER 3-SIGMA CONTROL LIMITS FOR R-CHART? HOW WOULD THAT CHANGE THE GIVEN FORMULA?
(UCLR) =_?__

- In a research on weight of cereal dispersed into a box of cereal, a company collected m=12 sets of inside ring diameter samples with a subgroup size of n=6 , the grand mean =17.8 ounces and the average range =1.02 ounces. Determine the upper control limit for an R chart. Enter your answer to 2 decimal places.arrow_forward54 Boxes of Honey-Nut Oatmeal are produced to contain 14.0 ounces, with a standard deviation of 0.20 ounce. For a sample size of 64, the 3-sigma X chart control limits are: Upper Control Limit (UCL) = ounces (round your response to two decimal places).arrow_forward2- Quality Control Charts A local brewery and bottling plant wants to keep track of the bottling filling equipment's accuracy, Bottles are to be filled with exactly 16 ounces of the drink. The following is data from the bottling equipment where 5 samples of bottles filled were pulled every hour and measured for actual quantity filled. 1- Calculate the UCL, LCL and mean for the X-bar and R data 2- Draw an X-Bar chart and a R chart. 3- Is this filling process in control or out of control? Hour X-bar R 1 16.05 .20 2 16.03 3 15.96 4 15.97 16.03 16.06 15.98 16.09 15.94 16.01 5 6 7 8 9 10 @n-5: A2 = 0.58, D3 =0, D4 = 2.11 .25 .62 .58 .71 .37 .46 .21 .35 .29arrow_forward
- Can you verify these answers please.arrow_forwardLinda Boardman, Inc., an equipment manufacturer in Boston, has submitted a sample cutoff valve to improve your manufacturing process. Your process engineering department has conducted experiments and found that the valve has a mean (u) of 12.00 and a standard deviation (a) of 0.04. Your desired performance is μ = 12.00 +3 standard deviations, where a = 0.045. For the given information, the process capability index (Cpk) - (round your response to three decimal places).arrow_forwardPlease answer this question What is the acceptable standard deviation range for running of quality controls?arrow_forward
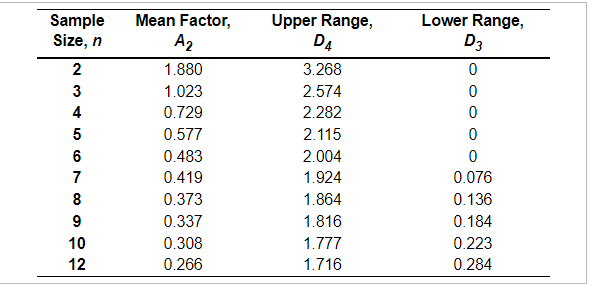
- Lower Range, Sample Size, n Mean Factor, Upper Range, DA A2 D3 2 1.880 3.268 3 1.023 2.574 4 0.729 2.282 5 0.577 2.115 6 0.483 2.004 7 0.419 1.924 0.076 8 0.373 1.864 0.136 0.337 1.816 0.184 10 0.308 1.777 0.223 12 0.266 1.716 0.284arrow_forwardThe results of inspection of DNA samples taken over the past 10 days are given below. Sample size is 100. LCLp Day Defectives = 1 5 2 7 3 7 4 9 5 5 6 6 a) The upper and lower 3-sigma control chart limits are: UCL = 0.127 (enter your response as a number between 0 and 1, rounded to three decimal places). (enter your response as a number between 0 and 1, rounded to three decimal places). 7 1 8 6 9 10 10 1arrow_forwardK The school board is trying to evaluate a new math program introduced to second-graders in five elementary schools across the county this year. A sample of the student scores on standardized math tests in each elementary school yielded the following data: School A 4 C E No. of Test Errors 48 21 32 40 52 For the test errors, the c-chart with control limits that contain 99.73% of the random variation in test scores is: UCL = errors (round your response to two decimal places).arrow_forward
- Resistors for electronic circuits are manufactured on a high-speed automated machine. The machine is set up to produce a large run of resistors of 1,000 ohms each. Use Exhibit 13.7. To set up the machine and to create a control chart to be used throughout the run, 15 samples were taken with four resistors in each sample. The complete list of samples and their measured values are as follows. Use three-sigma control limits. SAMPLE NUMBER 1 H234STO OHN345 5 6 7 8 9 10 11 ΕΕΕΕΕ 12 13 14 15 READINGS (IN OHMS) 1097 1094 978 1013 976 1016 977 986 983 1026 988 1014 991 1030 995 991 1023 1014 982 970 1030 1027 1017 1004 995 982 994 1008 1001 1004 995 1015 1026 978 1017 984 995 1007 988 970 1004 1028 1019 983 990 1026 1017 1010 987 994 1030 974 995 1012 1016 1011 983 1018 981 1020arrow_forwardArana is a company that produces homemade Rotini pasta. They use statistical process control to monitor the manufacturing process. The company collects five samples, each containing six packs of pasta. Below is the sample data, but the standard deviation of the process output is unknown. If an R chart is created using three-sigma limits (i.e., z = 3) to monitor the variability of products, what would be the upper control limit for this R chart? Sample 1 Sample 2 Sample 3 Pack 1 452.3 451.6 448.6 Sample 4 454.7 Sample 5 448.9 7.614 9.328 11.653 13.427 Pack 2 452.8 451.2 455.6 451.7 453.4 Pack 3 456 454.6 456.5 451 456.7 Pack 4 457.2 455.3 451.9 452.6 456.3 Pack 5 457.8 452.2 455.6 454.7 452.4 Pack 6 451.8 451.9 448.3 458.4 456arrow_forward6-9. A process that produces computer chips has a mean of .04 defective chip and a standard deviation of .003 chip. The allowable variation is from .03 to .05 defective. (a) Compute the capability index for the process (b) Is the process capable?arrow_forward
- Practical Management ScienceOperations ManagementISBN:9781337406659Author:WINSTON, Wayne L.Publisher:Cengage,
 Operations ManagementOperations ManagementISBN:9781259667473Author:William J StevensonPublisher:McGraw-Hill Education
 Operations and Supply Chain Management (Mcgraw-hi...Operations ManagementISBN:9781259666100Author:F. Robert Jacobs, Richard B ChasePublisher:McGraw-Hill Education
 Purchasing and Supply Chain ManagementOperations ManagementISBN:9781285869681Author:Robert M. Monczka, Robert B. Handfield, Larry C. Giunipero, James L. PattersonPublisher:Cengage Learning
 Production and Operations Analysis, Seventh Editi...Operations ManagementISBN:9781478623069Author:Steven Nahmias, Tava Lennon OlsenPublisher:Waveland Press, Inc.