
Practical Management Science
6th Edition
ISBN: 9781337406659
Author: WINSTON, Wayne L.
Publisher: Cengage,
expand_more
expand_more
format_list_bulleted
Related questions
Concept explainers
Question
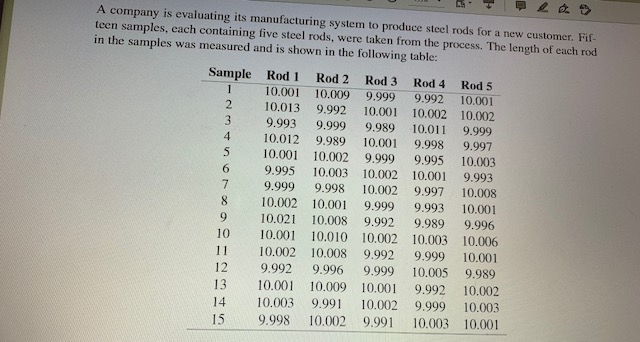

Transcribed Image Text:A company is evaluating its manufacturing system to produce steel rods for a new customer. Fif-
teen samples, cach containing five steel rods, were taken from the process. The length of each rod
in the samples was measured and is shown in the following table:
Sample Rod 1
10.001
Rod 2
Rod 3
Rod 4
Rod 5
1
10.009
9.999
10.001
9.992
10.002
10.013
9.992
10.001
10.002
9.999
9.997
3
9.993
10.012
9.999
9.989
10.011
4
9.989
10,001
9.998
5
10.001
10.002
9.999
9.995
10.003
9.993
6.
9.995
10.003
10.002
10.001
7.
9.999
9.998
10.002
9.997
9.993
10.008
8.
10.002
10.001
9.999
10.001
9
10.021
10.008
9.992
9.989
9.996
10
10.001
10.010 10.002
10.003
10.006
11
10.002
10.008
9.992
9.999
10.001
12
9.992
9.996
9.999
10.005
9.989
13
10.001
10.009 10.001
9.992
10.002
14
10.003
9.991
10.002
9.999
10.003
15
9.998
10.002
9.991
10.003
10.001

Transcribed Image Text:a. Determine the upper and lower control limits and the overall means for I-charts and R-
charts. Draw the chart and plot the values of the sample means and ranges. Do the data.
indicate a process that is in control? Why or why not? (Data is also available as an Excel file
in D2L)
b. The steel rods will go to a customer that is expecting each rod to meet a 10+0.05cm tolerance
level. A selling point for the company is that it meets 60 quality. Compute the capability
ratios (C, and Cuk) to show if the current manufacturing system is capable and if it meets
the desired quality standard.
Expert Solution
This question has been solved!
Explore an expertly crafted, step-by-step solution for a thorough understanding of key concepts.

Step by stepSolved in 2 steps with 36 images

Knowledge Booster


Learn more about
Need a deep-dive on the concept behind this application? Look no further. Learn more about this topic, operations-management and related others by exploring similar questions and additional content below.Similar questions
- The time needed for performing a machining operation is to be investigated. Historically, the process has had a standard deviation equal to 0.146 minutes. The means (in minutes) of 39 samples of n = 6 are: sample mean sample mean sample mean 1 3.86 14 3.81 27 3.81 2 3.90 15 3.83 28 3.86 3 3.83 16 3.86 29 3.98 4 3.81 17 3.82 30 3.96 5 3.84 18 3.86 31 3.88 6 3.83 19 3.84 32 3.76 7 3.87 20 3.87 33 3.83 8 3.88 21 3.84 34 3.77 9 3.84 22 3.82 35 3.86 10 3.80 23 3.89 36 3.80 11 3.88 24 3.86 37 3.84 12 3.86 25 3.88 38 3.79 13 3.88 26 3.90 39 3.85 the averagee of the 39-sample means is equal to 3.85. construct an xbar-chart for this process with two-sigma limits. Is the process in control?arrow_forwardAuto pistons at Wemming Chung's plant in Shanghai are produced in a forging process, and the diameter is a critical factor that must be controlled. From sample sizes of 5 pistons produced each day, the mean and the range of this diameter have been as follows: Day Mean (mm) Range R (mm) 158 4.3 151.2 4.4 155.7 4.2 153.5 4.8 156.6 4.5 What is the UCL using 3-sigma?(round your response to two decimal places). 1. 2. 4.arrow_forwardAspen Plastics produces plastic bottles to customer order.The quality inspector randomly selects four bottles fromthe bottle machine and measures the outside diameter ofthe bottle neck, a critical quality dimension that determineswhether the bottle cap will fit properly. The dimensions(inch) from the last six samples are Assume that only these six samples are sufficient, and use thedata to determine control limits for an R- and an x-chart.arrow_forward
- Control charts for X-bar and S are maintained for the fill volume of protein shake drink. The specifications are 330 + 10 mL. After 40 samples of size n=7 are analyzed, we find that: 40 40 = 13,200 Si = 296 i=1 i=D1 Find the best estimate of the process standard deviation. 7.498 7.400 7.570 2.737 7.713 8.032arrow_forwardTwelve samples, each containing five parts, were taken from a process that produces steel rods at Emmanual Kodzi's factory. The length of each rod in the samples was determined. The results were tabulated and sample means and ranges were computed. The results were: Sample Sample Mean (in.) Range (in.) Sample Sample Mean (in.) Range (in.) 1 9.602 0.033 7 9.603 0.041 2 9.602 0.041 8 9.605 0.034 3 9.593 0.034 9 9.597 0.027 4 9.606 0.051 10 9.601 0.029 5 9.599 0.031 11 9.603 0.039 6 9.599 0.036 12 9.606 0.047 Part 2 For the given data, the x double overbarx = 9.6013 inches (round your response to four decimal places). Part 3 Based on the sampling done, the control limits for 3-sigma x overbarx chart are: Upper Control Limit (UCL Subscript x…arrow_forwardSampling 4 pieces of precision-cut wire (to be used in computer assembly) every hour for the past 24 hours has produced the following results: Hour x R Hour x R Hour x R Hour x R 1 3.15" 0.71" 7 3.15" 0.58" 13 3.21" 0.80" 19 3.31" 1.61" 2 3.20 1.23 8 2.75 1.18 14 2.83 1.31 20 2.79 1.09 3 3.12 1.38 9 3.02 0.71 15 3.02 1.01 21 2.65 1.13 4 3.39 1.31 10 2.75 1.38 16 2.94 0.50 22 3.38 0.51 5 3.07 1.17 11 2.93 1.22 17 2.86 1.43 23 2.94 1.63 6 2.76 0.37 12 2.87 0.40 18 2.64 1.29 24 2.64 0.92 Based on the sampling done, the control limits for 3-sigma x chart are (round all intermediate calculations to three decimal places…arrow_forward
- Aspen Plastics produces plastic bottles to customer order. The quality inspector randomly selects four bottles from the bottle machine and measures the outside diameter of the bottle neck, a critical quality dimension that determines whe the bottle cap will fit properly. The dimensions (in.) from the last six samples are Bottle Sample 1 2 4 1 0.602 0.601 0.604 0.594 2 0.588 0.581 0.612 0.573 0.588 0.571 0.578 0.574 4 0.582 0.612 0.603 0.582 5 0.596 0.602 0.597 0.609 6 0.583 0.602 0.615 0.579 Click the icon to view the table of factors for calculating three-sigma limits for the x-chart and R-chart. Suppose that the specification for the bottle neck diameter is 0.600 ± 0.050 in. and the population standard deviation i 0.012 in. a. What is the process capability index? The Cok is 1.19. (Enter your response rounded to two decimal places.) b. The process capability ratio? The Cp is (Enter your response rounded to two decimal places.)arrow_forward2- Quality Control Charts A local brewery and bottling plant wants to keep track of the bottling filling equipment's accuracy, Bottles are to be filled with exactly 16 ounces of the drink. The following is data from the bottling equipment where 5 samples of bottles filled were pulled every hour and measured for actual quantity filled. 1- Calculate the UCL, LCL and mean for the X-bar and R data 2- Draw an X-Bar chart and a R chart. 3- Is this filling process in control or out of control? Hour X-bar R 1 16.05 .20 2 16.03 3 15.96 4 15.97 16.03 16.06 15.98 16.09 15.94 16.01 5 6 7 8 9 10 @n-5: A2 = 0.58, D3 =0, D4 = 2.11 .25 .62 .58 .71 .37 .46 .21 .35 .29arrow_forwardA control chart for fraction nonconforming is to be established using a center line of p=0.03. What sample size is required if we wish to detect a shift in the process fraction nonconforming to 0.08 with probability 0.50? 1269 475 73 316 216 2 105 150 265arrow_forward
- Lower Range, Sample Size, n Mean Factor, Upper Range, DA A2 D3 2 1.880 3.268 3 1.023 2.574 4 0.729 2.282 5 0.577 2.115 6 0.483 2.004 7 0.419 1.924 0.076 8 0.373 1.864 0.136 0.337 1.816 0.184 10 0.308 1.777 0.223 12 0.266 1.716 0.284arrow_forwardThe results of inspection of DNA samples taken over the past 10 days are given below. Sample size is 100. LCLp Day Defectives = 1 5 2 7 3 7 4 9 5 5 6 6 a) The upper and lower 3-sigma control chart limits are: UCL = 0.127 (enter your response as a number between 0 and 1, rounded to three decimal places). (enter your response as a number between 0 and 1, rounded to three decimal places). 7 1 8 6 9 10 10 1arrow_forwardIn a fabric manufacturing factory, the quality control process using control charts from SPC. In an hour there are a total of 5 samples are taken each having 5 observations regarding the thickness of fabric in measured in millimeters. In a particular hour, the sample means (X-bar) are noted to be: 172.11, 219.51 . 208.24, 112.44 and 123.30 respectively. In the same sample, the corresponding ranges are: 13.1713.3815.34, 13.04, and 13.02 respectively What are the lower and upper control limits for the R chart?arrow_forward
arrow_back_ios
SEE MORE QUESTIONS
arrow_forward_ios
Recommended textbooks for you
- Practical Management ScienceOperations ManagementISBN:9781337406659Author:WINSTON, Wayne L.Publisher:Cengage,
 Operations ManagementOperations ManagementISBN:9781259667473Author:William J StevensonPublisher:McGraw-Hill Education
 Operations and Supply Chain Management (Mcgraw-hi...Operations ManagementISBN:9781259666100Author:F. Robert Jacobs, Richard B ChasePublisher:McGraw-Hill Education
 Purchasing and Supply Chain ManagementOperations ManagementISBN:9781285869681Author:Robert M. Monczka, Robert B. Handfield, Larry C. Giunipero, James L. PattersonPublisher:Cengage Learning
 Production and Operations Analysis, Seventh Editi...Operations ManagementISBN:9781478623069Author:Steven Nahmias, Tava Lennon OlsenPublisher:Waveland Press, Inc.
Practical Management Science
Operations Management
ISBN:9781337406659
Author:WINSTON, Wayne L.
Publisher:Cengage,
Operations Management
Operations Management
ISBN:9781259667473
Author:William J Stevenson
Publisher:McGraw-Hill Education
Operations and Supply Chain Management (Mcgraw-hi...
Operations Management
ISBN:9781259666100
Author:F. Robert Jacobs, Richard B Chase
Publisher:McGraw-Hill Education
Purchasing and Supply Chain Management
Operations Management
ISBN:9781285869681
Author:Robert M. Monczka, Robert B. Handfield, Larry C. Giunipero, James L. Patterson
Publisher:Cengage Learning
Production and Operations Analysis, Seventh Editi...
Operations Management
ISBN:9781478623069
Author:Steven Nahmias, Tava Lennon Olsen
Publisher:Waveland Press, Inc.