
MATLAB: An Introduction with Applications
6th Edition
ISBN: 9781119256830
Author: Amos Gilat
Publisher: John Wiley & Sons Inc
expand_more
expand_more
format_list_bulleted
Related questions
Question
thumb_up100%
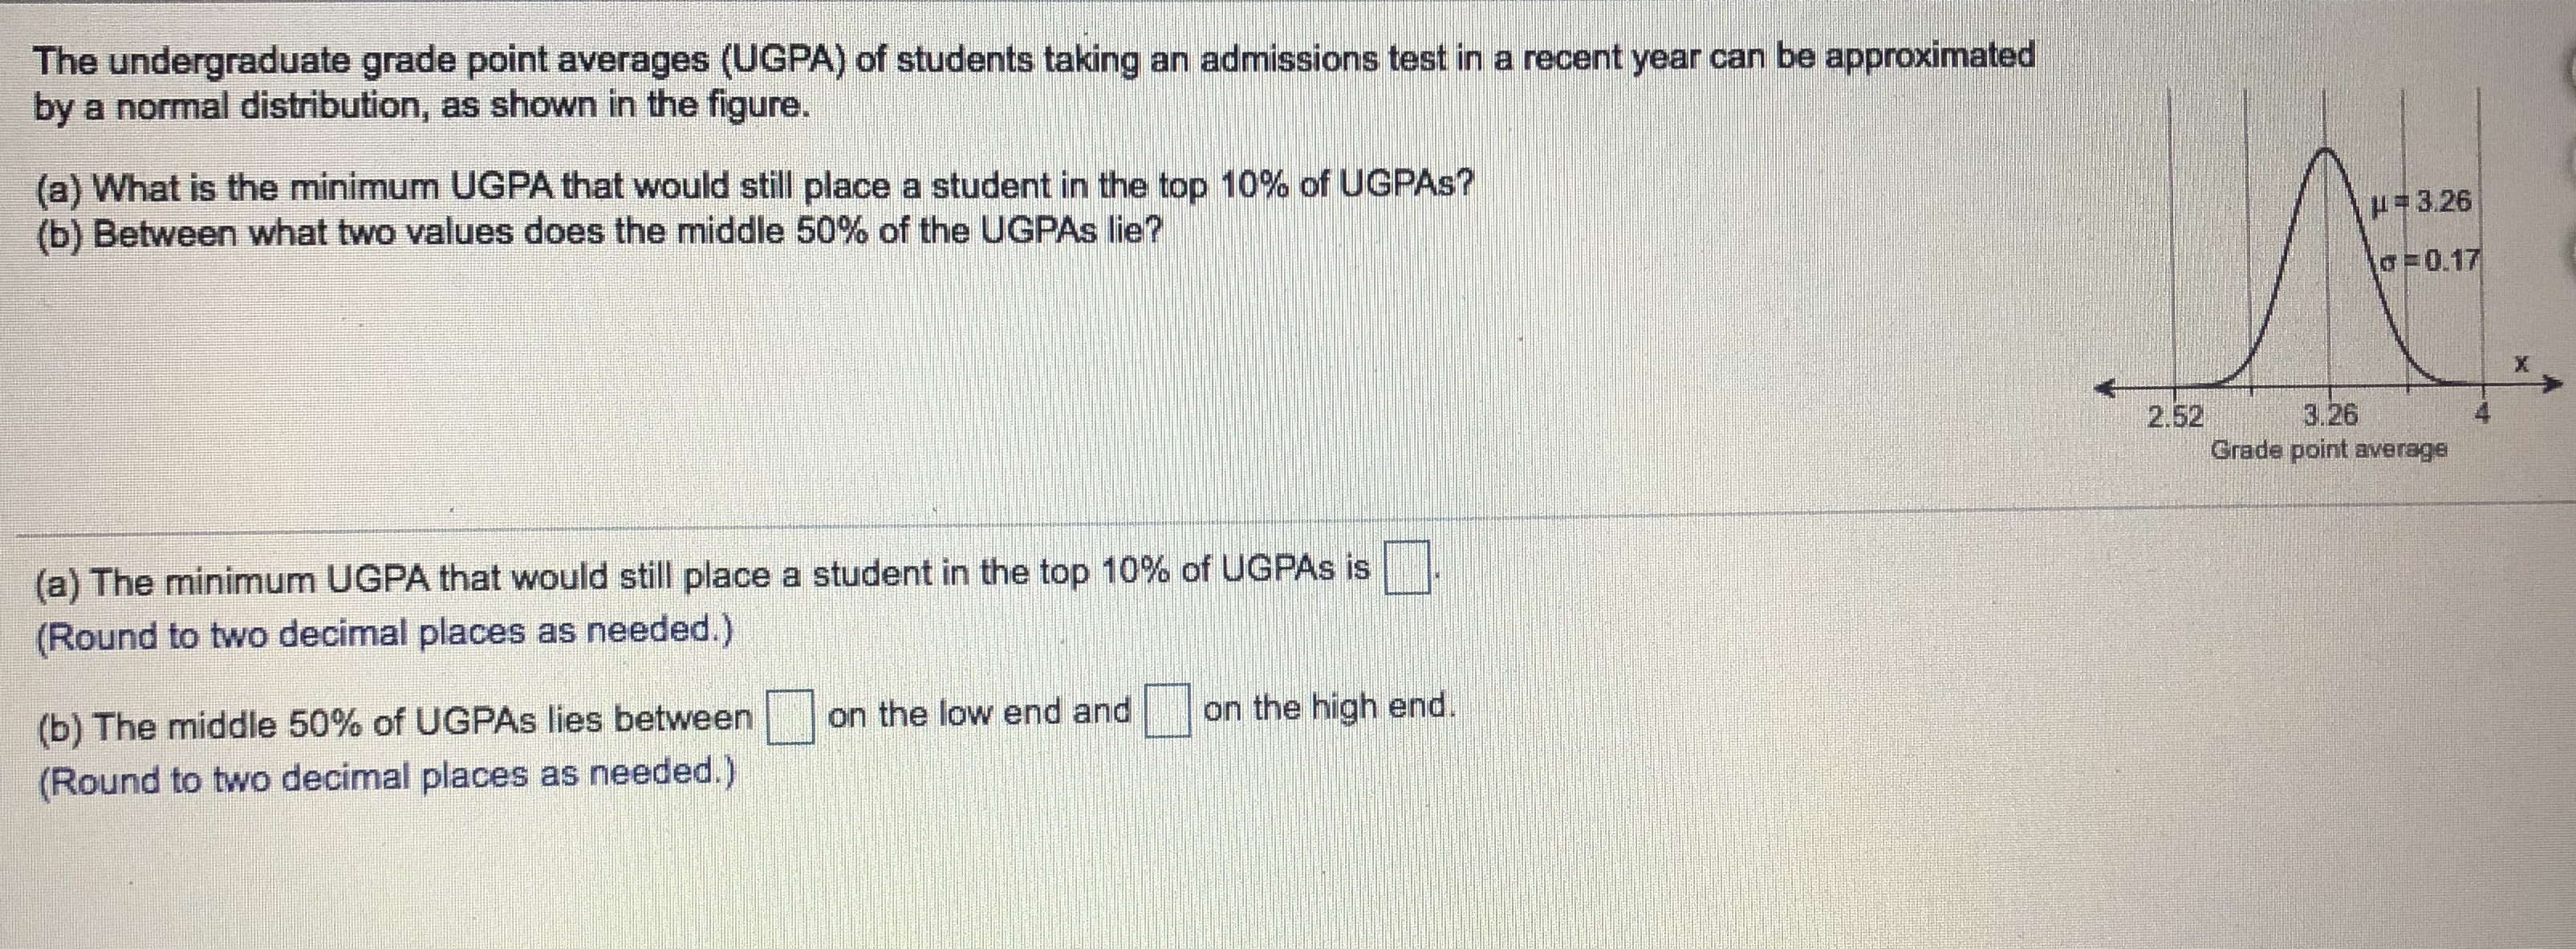

Transcribed Image Text:The undergraduate grade point averages (UGPA) of students taking an admissions test in a recent year can be approximated
by a normal distribution, as shown in the figure.
(a) What is the minimum UGPA that would still place a student in the top 10% of UGPAS?
(b) Between what two values does the middle 50% of the UGPAS Ilie?
#3.26
o=0.17
3.26
2.52
Grade point average
(a) The minimum UGPA that would still place a student in the top 10% of UGPAS is
(Round to two decimal places as needed.)
on the high end.
on the low end and
(b) The middle 50% of UGPAS lies between
(Round to two decimal places as needed.)
4.
Expert Solution
This question has been solved!
Explore an expertly crafted, step-by-step solution for a thorough understanding of key concepts.

This is a popular solution

Trending nowThis is a popular solution!

Step by stepSolved in 2 steps with 2 images

Knowledge Booster

Similar questions
- Ñ2arrow_forwardeat out or in The overall change in the consumer price index is a weighted average of changes in various categories. on november 19, 2011 the boston globe reported the data displayed in figure 5.7. is it reasonable to say that about 40% of food expenses are for food away from home?arrow_forwardThe t-score distribution for df = 4 resembles the z-score distribution in shape more than a t-score distribution for df = 20. a. True b. Falsearrow_forward
- Sunscreens are products that protect the skin from skin cancer by preventing the sun's ultraviolet (UV) radiation from penetrating the skin. According to dermatologists, the recommended amount of sunscreen needed to cover the exposed areas of the body is at least an ounce. In a study conducted specifically for a group of women aged 21 to 30 years, it was found the amount of sunscreen (X) applied by the group follows the normal distribution with mean of 0.6 ounce and standard deviation of 0.25 ounce. About ___% of the women aged 21 to 30 years is applying 0.1 to 1.1 ounce ofarrow_forwardCalories consumed by members of a track team the day before a race are normally distributed, with a mean of 1,800 calories and a standard deviation of 100 calories. If a normal curve is sketched using these data, what is the range for 3 standard deviations to the right and to the left of the mean? Group of answer choices 0–3,600 1,700–1,900 1,600–2,000 1,500–2,100arrow_forwardAssume the samples are random and independent, the populations are nomally distributed, and the population variances are equal. The table available below shows the prices (in dollars) for a sample of automobile batteries. The prices are classified according to battery type. At a = 0.10, is there enough evidence conclude that at least one mean battery price is different from the others? Complete parts (a) through (e) below. E Click the icon to view the battery cost data. (a) Let u1. P2. H3 represent the mean prices for the group size 35, 65, and 24/24F respectively. Identify the claim and state Ho and H. H Cost of batteries by type The claim is the V hypothesis. Group size 35 Group size 65 Group size 24/24F 101 111 121 124 D 146 173 182 278 124 140 141 89 (b) Find the critical value, Fo, and identify the rejection region. 90 79 84 The rejection region is F Fo, where Fo = (Round to two decimal places as needed.) (c) Find the test statistic F. Print Done F= (Round to two decimal places as…arrow_forward
- The distribution of heights in a population of women is approximately normal. Sixteen percent of the women have heights less than 62 inches. About 97.5% of the women have heights less than 71 inches. Use the empirical rule to estimate the mean and standard deviation of the heights in this population. Mean: K inches Standard Deviation: inchesarrow_forwardScores on an exam follow an approximately Normal distribution with a mean of 76.4 and a standard deviation of 6.1 points. What percent of students scored above 80 points?arrow_forwardThis assignment is worth 1 points. The extra point will be added to your overall course grade. For example: if you receive an 88% in the course you can receive up to 1 point giving you a new score of 89%. The following rubric will be used. 0.25 point for drawing the normal distribution curve with the mean value labeled on the curve and the appropriate area shaded. 0.25 point for determining the value of the standard deviation of the sample mean. 0.5 point for finding the correct probability. All work must be shown in order to receive any credit. Please upload your completed assignment here. The length of time taken on the SAT for a group of students is normally distributed with a mean of 2.5 hours and a standard deviation of 0.25 hours. A sample size of n = 60 is drawn randomly from the population. Find the probability that the sample mean is between two hours and three hours.arrow_forward
- Use the normal distribution of SAT critical reading scores for which the mean is 502 and the standard deviation is 116. Assume the variable x is normally distributed. (a) What percent of the SAT verbal scores are less than 550? (b) If 1000 SAT verbal scores are randomly selected, about how many would you expect to be greater than 525? Click to view page 1 of the standard normal table. Click to view page 2 of the standard normal table. (a) Approximately % of the SAT verbal scores are less than 550. (Round to two decimal places as needed.)arrow_forward1. Find the p-value. (Round to three or more decimal places.) 2. At the 0.01 level of significance, can the doctor conclude that the mean recovery time of patients who have the new procedure is less than the mean recovery time of patients who have the standard procedure?arrow_forwardSunscreens are products that protect the skin from skin cancer by preventing the sun's ultraviolet (UV) radiation from penetrating the skin. According to dermatologists, the recommended amount of sunscreen needed to cover the exposed areas of the body is at least an ounce. In a study conducted specifically for a group of women aged 21 to 30 years, it was found the amount of sunscreen (X) applied by the group follows the normal distribution with mean of 0.6 ounce and standard deviation of 0.25 ounce. The amount of sunscreen applied by women aged 21 to 30 years follows a bell-shaped distribution which is symmetric at X = _____.arrow_forward
arrow_back_ios
arrow_forward_ios
Recommended textbooks for you
- MATLAB: An Introduction with ApplicationsStatisticsISBN:9781119256830Author:Amos GilatPublisher:John Wiley & Sons Inc
 Probability and Statistics for Engineering and th...StatisticsISBN:9781305251809Author:Jay L. DevorePublisher:Cengage Learning
 Statistics for The Behavioral Sciences (MindTap C...StatisticsISBN:9781305504912Author:Frederick J Gravetter, Larry B. WallnauPublisher:Cengage Learning
  Elementary Statistics: Picturing the World (7th E...StatisticsISBN:9780134683416Author:Ron Larson, Betsy FarberPublisher:PEARSON
 The Basic Practice of StatisticsStatisticsISBN:9781319042578Author:David S. Moore, William I. Notz, Michael A. FlignerPublisher:W. H. Freeman
 Introduction to the Practice of StatisticsStatisticsISBN:9781319013387Author:David S. Moore, George P. McCabe, Bruce A. CraigPublisher:W. H. Freeman
MATLAB: An Introduction with Applications
Statistics
ISBN:9781119256830
Author:Amos Gilat
Publisher:John Wiley & Sons Inc
Probability and Statistics for Engineering and th...
Statistics
ISBN:9781305251809
Author:Jay L. Devore
Publisher:Cengage Learning
Statistics for The Behavioral Sciences (MindTap C...
Statistics
ISBN:9781305504912
Author:Frederick J Gravetter, Larry B. Wallnau
Publisher:Cengage Learning
Elementary Statistics: Picturing the World (7th E...
Statistics
ISBN:9780134683416
Author:Ron Larson, Betsy Farber
Publisher:PEARSON
The Basic Practice of Statistics
Statistics
ISBN:9781319042578
Author:David S. Moore, William I. Notz, Michael A. Fligner
Publisher:W. H. Freeman
Introduction to the Practice of Statistics
Statistics
ISBN:9781319013387
Author:David S. Moore, George P. McCabe, Bruce A. Craig
Publisher:W. H. Freeman