
MATLAB: An Introduction with Applications
6th Edition
ISBN: 9781119256830
Author: Amos Gilat
Publisher: John Wiley & Sons Inc
expand_more
expand_more
format_list_bulleted
Related questions
Concept explainers
Topic Video
Question
thumb_up100%
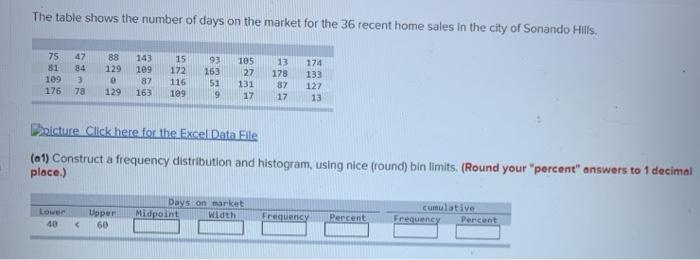

Transcribed Image Text:The table shows the number of days on the market for the 36 recent home sales in the city of Sonando Hills.
75
47
88
143
15
93
105
27
13
174
81
84
129
109
87
172
163
178
133
109
116
51
131
87
127
176
78
129
163
109
17
17
13
Doicture Click here for the Excel Data Ele
(a1) Construct a frequency distribution and histogram, using nice (round) bin limits. (Round your "percent" answers to 1 decimal
place.)
Days on market
Width
cumulative
Frequency
Lower
Upper
60
Midpoint
Frequency
Percent
Percent
40
Expert Solution
This question has been solved!
Explore an expertly crafted, step-by-step solution for a thorough understanding of key concepts.

This is a popular solution

Trending nowThis is a popular solution!

Step by stepSolved in 2 steps with 2 images

Knowledge Booster


Learn more about
Need a deep-dive on the concept behind this application? Look no further. Learn more about this topic, statistics and related others by exploring similar questions and additional content below.Similar questions
- please help. thank youarrow_forwardUse the same scales to construct boxplots for the pulse rates of males and females from the accompanying data sets. Use the boxplots to compare the two data sets. Click the icon to view the data sets. Men's Pulse Rates 62 60 70 70 62 86 82 77 76 74 Full data set 87 53 90 65 69 56 80 61 76 80 53 60 67 63 62 49 70 60 70 56 64 77 67 60 69 73 73 62 50 57 Women's Pulse Rates 78 68 70 70 77 76 98 70 66 78 70 58 74 77 78 92 95 60 100 100 77 64 84 63 72 77 75 90 88 73 83 71 76 103 62 70 70 89 74 80 Choose the graphs that represent (picture attached!!) Compare the two boxplots. Choose the correct answer below. A. In general, it appears that males have higher pulse rates than females. The variation among the male pulse rates is much greater…arrow_forwardStudents in a statistics class took their first test. The following are the scores they earned. Fill in the stem-and-leaf plot below use the tens place as the stem and the ones place as the leaf. Describe the shape of the distribution. 73 84 95 91 98 97 90 74 74 82 63 79 82 88 74 88 67 81 83 69 73 95 91 94 86 56 94 62 a) Data were collected for variable(s). Is it appropriate to make a stem-and-leaf plot for this type of data and number of variables? . b) Complete the stem-and-leaf plot below. You must put commas between the leaves. Stems Leaves 5 c) What shape is the stem-and-leaf plot above?arrow_forward
- Calculate the percentile for a student whose exam score is 81. Round your answer to the nearest whole number. x 50 57 58 60 60 64 66 67 67 70 72 75 75 75 79 80 83 83 83 86 87 87 88 89 95 96 96 99arrow_forwardRichard’s doctor had told him he needed to keep track of his blood sugar readings. Listed below are his 20 latest readings. He wanted to create a visual aid for himself in order to see how his blood sugar was doing. 75 125 110 82 178 209 150 130 120 142 90 98 107 163 135 129 147 152 110 100 A. Create a frequency distribution table for the given data set. B. Create a histogram for the data set. C. Describe the distribution of the data.arrow_forwardII On Friday night, the owner of Chez Pierre in downtown Chicago noted the amount spent for dinner for 28 four-person tables. 95 103 109 114 113 107 10 OLT 104 08 134 124 105 84 176 115 69 68 95 108 61 091 87 128 95 61 150 52 136 E Click here for the Excel Data File (a) Find the mean, median, and mode. (Round your answers to 2 decimal places.) Descriptive Statistics Data Count Mean Median Mode (b) Are the data symmetric or skewed? If skewed, which direction? O Symmetric O Skewed left O Skewed right Graw 11!H < Prev 10 of 19 ....... 2 Type here to search < įXƏNarrow_forward
arrow_back_ios
arrow_forward_ios
Recommended textbooks for you
- MATLAB: An Introduction with ApplicationsStatisticsISBN:9781119256830Author:Amos GilatPublisher:John Wiley & Sons Inc
 Probability and Statistics for Engineering and th...StatisticsISBN:9781305251809Author:Jay L. DevorePublisher:Cengage Learning
 Statistics for The Behavioral Sciences (MindTap C...StatisticsISBN:9781305504912Author:Frederick J Gravetter, Larry B. WallnauPublisher:Cengage Learning
  Elementary Statistics: Picturing the World (7th E...StatisticsISBN:9780134683416Author:Ron Larson, Betsy FarberPublisher:PEARSON
 The Basic Practice of StatisticsStatisticsISBN:9781319042578Author:David S. Moore, William I. Notz, Michael A. FlignerPublisher:W. H. Freeman
 Introduction to the Practice of StatisticsStatisticsISBN:9781319013387Author:David S. Moore, George P. McCabe, Bruce A. CraigPublisher:W. H. Freeman
MATLAB: An Introduction with Applications
Statistics
ISBN:9781119256830
Author:Amos Gilat
Publisher:John Wiley & Sons Inc
Probability and Statistics for Engineering and th...
Statistics
ISBN:9781305251809
Author:Jay L. Devore
Publisher:Cengage Learning
Statistics for The Behavioral Sciences (MindTap C...
Statistics
ISBN:9781305504912
Author:Frederick J Gravetter, Larry B. Wallnau
Publisher:Cengage Learning
Elementary Statistics: Picturing the World (7th E...
Statistics
ISBN:9780134683416
Author:Ron Larson, Betsy Farber
Publisher:PEARSON
The Basic Practice of Statistics
Statistics
ISBN:9781319042578
Author:David S. Moore, William I. Notz, Michael A. Fligner
Publisher:W. H. Freeman
Introduction to the Practice of Statistics
Statistics
ISBN:9781319013387
Author:David S. Moore, George P. McCabe, Bruce A. Craig
Publisher:W. H. Freeman