MATLAB: An Introduction with Applications
6th Edition
ISBN: 9781119256830
Author: Amos Gilat
Publisher: John Wiley & Sons Inc
expand_more
expand_more
format_list_bulleted
Topic Video
Question

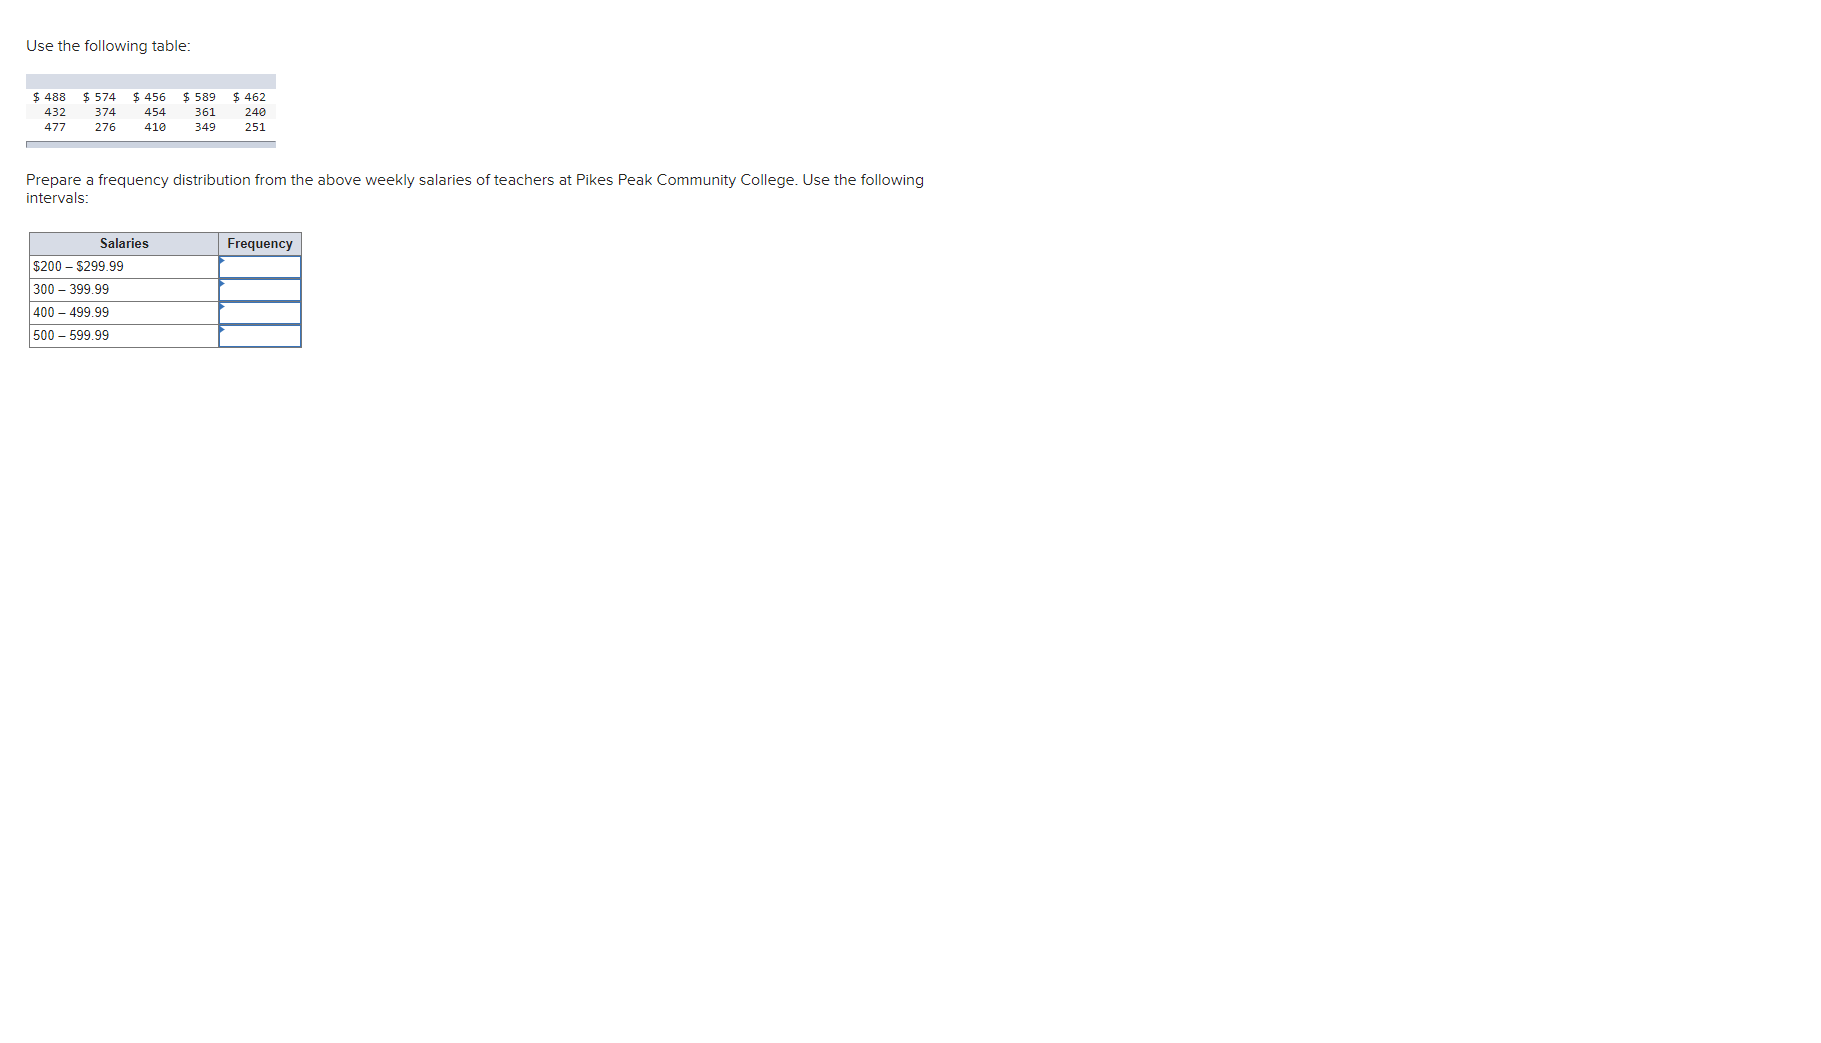
Transcribed Image Text:Use the following table:
$ 488
$ 574
$ 456
$ 589
$ 462
432
374
454
361
240
477
276
410
349
251
Prepare a frequency distribution from the above weekly salaries of teachers at Pikes Peak Community College. Use the following
intervals:
Salaries
Frequency
$200 – $299.99
300 – 399.99
400 – 499.99
500 - 599.99
Expert Solution
This question has been solved!
Explore an expertly crafted, step-by-step solution for a thorough understanding of key concepts.
This is a popular solution
Trending nowThis is a popular solution!
Step by stepSolved in 2 steps with 2 images

Knowledge Booster
Learn more about
Need a deep-dive on the concept behind this application? Look no further. Learn more about this topic, statistics and related others by exploring similar questions and additional content below.Similar questions
- 25arrow_forwardFill in the missing data. 2590 2440 1920 1870 1870 1420 1410 1390 1340 1200 1190 1170 1070 1020 919 900 889 856 793 777 752 723 680 661 649 Length Frequency 500-999 1000-1499 1500-1999 2000-2499 2500-2999arrow_forwardRichard’s doctor had told him he needed to keep track of his blood sugar readings. Listed below are his 20 latest readings. He wanted to create a visual aid for himself in order to see how his blood sugar was doing. 75 125 110 82 178 209 150 130 120 142 90 98 107 163 135 129 147 152 110 100 A. Create a frequency distribution table for the given data set. B. Create a histogram for the data set. C. Describe the distribution of the data.arrow_forward
- Second image is data setarrow_forwardFinish times (to the nearest hour) for 59 dogsled teams are shown below. Draw a relative-frequency histogram. Use five classes. 261 274 236 244 280 296 284 296 288 288 250 256 338 360 341 333 261 267 287 296 313 311 307 307 299 303 277 283 304 305 286 290 286 287 297 299 332 330 309 326 307 326 285 291 295 298 306 315 310 318 318 320 333 321 323 324 327 302 319 The frequency table for the above data is given below. Class Limits Boundaries Midpoint Freq. Relative Freq. Cumulative Freq. 236 – 260 235.5 – 260.5 248 4 0.07 4 261 – 285 260.5 – 285.5 273 9 0.15 13 286 – 310 285.5 – 310.5 298 26 0.44 39 311 – 335 310.5 – 335.5 323 17 0.29 56 336 – 360 335.5 – 360.5 348 3 0.05 59arrow_forwardBelow is the frequency distribution of personal Computers on by students at a community college. Find the percent represented by sony computers brand Frequency dell 3,200 sony 5,200 hp 4,400 toshiba 6,600 asus. 3,600arrow_forward
- Construct an ordered stem and leaf display for the following data. 91 104 90 109 118 89 116 127 107 98 100 96 92 114 95 122 Complete the ordered stem and leaf diagram below. 10 11 12arrow_forwardA data set is summarized in the frequency table below. The data set contains a total of 30 data values. What is the missing frequency? Value Frequency 1 5 2 3 3 4 4 6 5 □ 6 2 7 3 8 4arrow_forwardUse R to create an absolute frequency histogram for the sampled number of residents in 2010 by census tract. POP2010: 3030, 2132, 3496, 2696, 3375, 4380, 4741, 4288, 7290, 3861, 2973, 2823, 2767, 3948, 2662, 2719, 2670, 4953, 4000, 6538, 6426, 6903, 4222, 3339, 3683, 4884, 2561, 2655, 8383, 5021, 5334, 4206, 3988, 3227, 4963, 2962, 4291, 2089, 1926, 1705, 5578, 4473, 5697, 3086, 4362, 4832, 4099, 3620, 2685, 3475, 1568, 3491, 3697, 4268, 3922, 2719, 4209, 3616, 4517, 4635, 3068, 3388, 3562, 3813, 2504, 3418, 3479, 2835, 5916, 3587, 4140, 3238, 6183, 5470, 3897, 3175, 4673, 4964, 3149, 5940, 3307, 2620, 3825, 3547, 2189, 2715, 3807, 3709, 5781, 1634, 6252, 3503, 2079, 3828, 1980, 2272, 4827, 3594, 4778, 3480, 4799, 2208, 3666, 3726, 5581, 3517, 2674, 2000, 4343, 4339, 1733, 4792, 5722, 3996, 4563, 3642, 2090, 4358, 1658, 3388, 2703, 2976, 2417, 5003, 5574, 4842, 4045, 2898, 2792, 2349, 2920, 4174, 1402, 4796, 4753, 2644, 6311, 4701, 4110, 4645, 3426, 4493, 4552, 3823, 3873, 3281, 2819,…arrow_forward
arrow_back_ios
SEE MORE QUESTIONS
arrow_forward_ios
Recommended textbooks for you
 MATLAB: An Introduction with ApplicationsStatisticsISBN:9781119256830Author:Amos GilatPublisher:John Wiley & Sons Inc
 Probability and Statistics for Engineering and th...StatisticsISBN:9781305251809Author:Jay L. DevorePublisher:Cengage Learning
 Statistics for The Behavioral Sciences (MindTap C...StatisticsISBN:9781305504912Author:Frederick J Gravetter, Larry B. WallnauPublisher:Cengage Learning
 Elementary Statistics: Picturing the World (7th E...StatisticsISBN:9780134683416Author:Ron Larson, Betsy FarberPublisher:PEARSON
 The Basic Practice of StatisticsStatisticsISBN:9781319042578Author:David S. Moore, William I. Notz, Michael A. FlignerPublisher:W. H. Freeman
 Introduction to the Practice of StatisticsStatisticsISBN:9781319013387Author:David S. Moore, George P. McCabe, Bruce A. CraigPublisher:W. H. Freeman

MATLAB: An Introduction with Applications
Statistics
ISBN:9781119256830
Author:Amos Gilat
Publisher:John Wiley & Sons Inc

Probability and Statistics for Engineering and th...
Statistics
ISBN:9781305251809
Author:Jay L. Devore
Publisher:Cengage Learning

Statistics for The Behavioral Sciences (MindTap C...
Statistics
ISBN:9781305504912
Author:Frederick J Gravetter, Larry B. Wallnau
Publisher:Cengage Learning

Elementary Statistics: Picturing the World (7th E...
Statistics
ISBN:9780134683416
Author:Ron Larson, Betsy Farber
Publisher:PEARSON

The Basic Practice of Statistics
Statistics
ISBN:9781319042578
Author:David S. Moore, William I. Notz, Michael A. Fligner
Publisher:W. H. Freeman

Introduction to the Practice of Statistics
Statistics
ISBN:9781319013387
Author:David S. Moore, George P. McCabe, Bruce A. Craig
Publisher:W. H. Freeman