
MATLAB: An Introduction with Applications
6th Edition
ISBN: 9781119256830
Author: Amos Gilat
Publisher: John Wiley & Sons Inc
expand_more
expand_more
format_list_bulleted
Related questions
Question
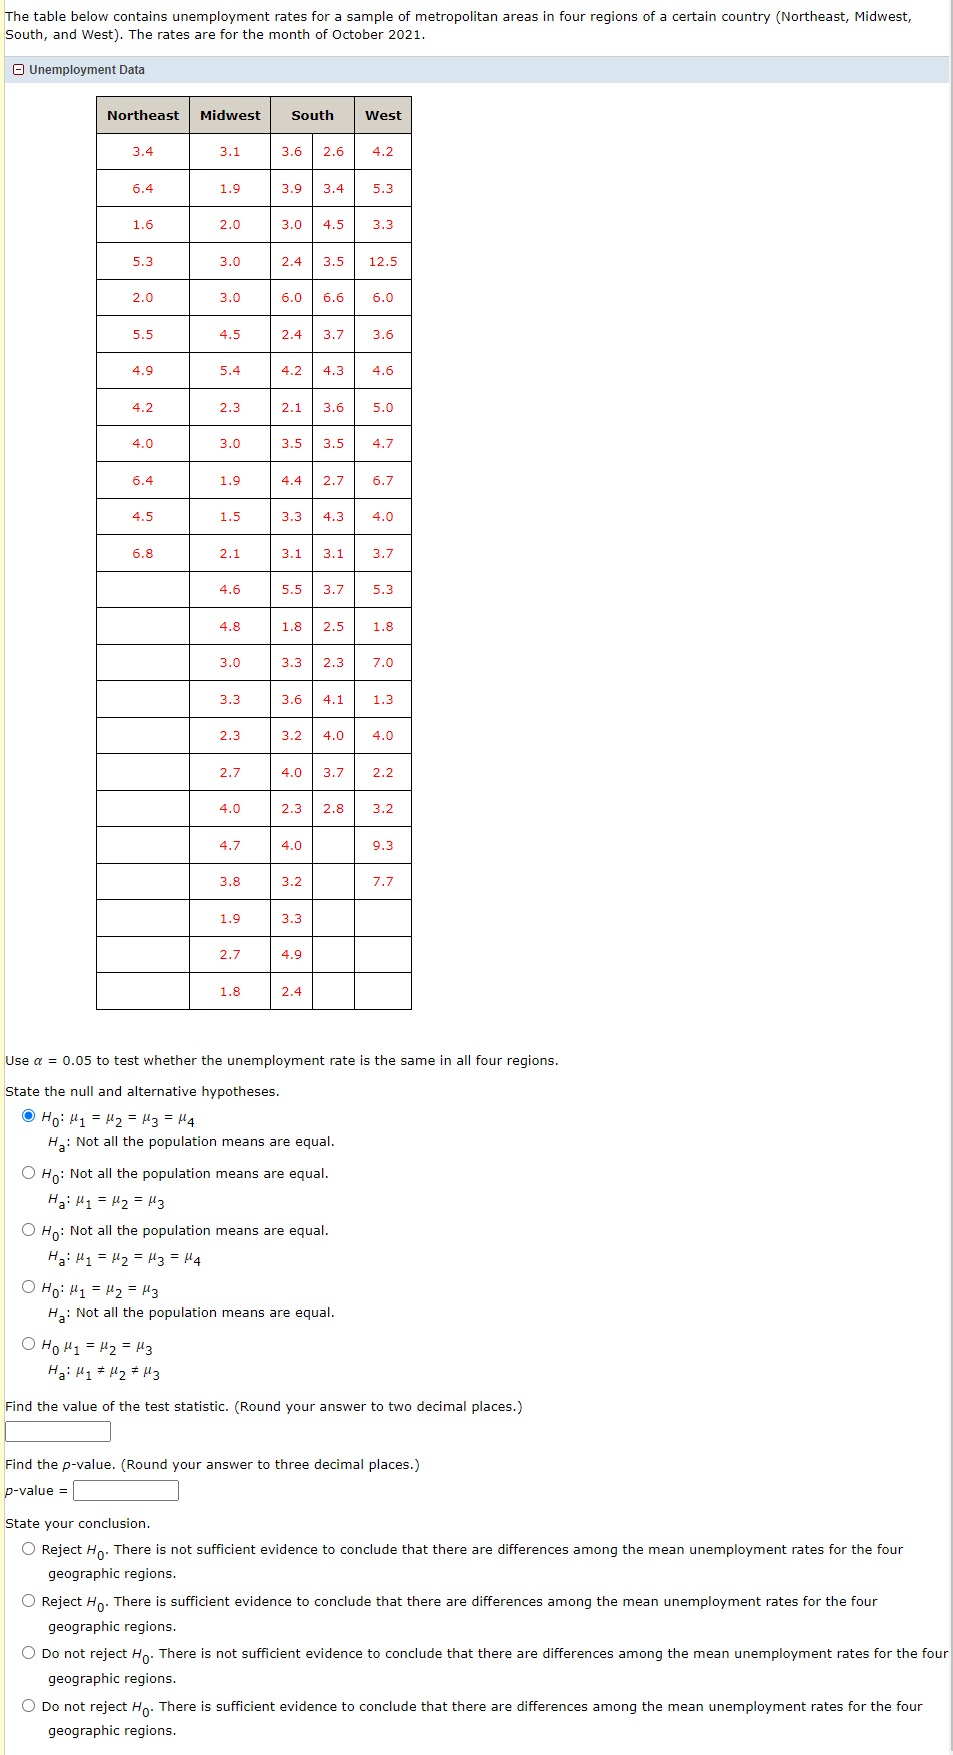

Transcribed Image Text:The table below contains unemployment rates for a sample of metropolitan areas in four regions of a certain country (Northeast, Midwest,
South, and West). The rates are for the month of October 2021.
E Unemployment Data
Northeast
3.4
6.4
1.6
5.3
2.0
5.5
4.9
4.2
4.0
6.4
4.5
6.8
Midwest
3.1
1.9
2.0
3.0
3.0
4.5
5.4
2.3
3.0
1.9
1.5
2.1
4.6
4.8
3.0
3.3
2.3
2.7
4.0
4.7
3.8
1.9
2.7
1.8
South
3.6 2.6
3.9 3.4
3.0 4.5
2.4 3.5 12.5
2.1 3.6
6.0 6.6 6.0
3.5 3.5
2.4 3.7 3.6
4.2 4.3 4.6
1.8 2.5
West
4.2
4.4 2.7 6.7
5.3
3.3 4.3 4.0
3.3
3.1 3.1 3.7
5.5 3.7 5.3
4.0
3.2
3.3 2.3 7.0
3.3
5.0
3.6 4.1 1.3
4.9
4.7
3.2 4.0 4.0
2.4
4.0 3.7 2.2
2.3 2.8 3.2
O Ho: Not all the population means are equal.
на: М1 = М2 = M3
O Ho: Not all the population means are equal.
Ha: M₁ = M₂ = M3 = μ4
Ho: M₁ = ₂ = μ3
Ha: Not all the population means are equal.
1.8
Use a = 0.05 to test whether the unemployment rate is the same in all four regions.
State the null and alternative hypotheses.
Ho: H₁ H₂= μ3 = μ4
Ha: Not all the population means are equal.
9.3
7.7
оно H1=H2=3
на: М1 #Мz #из
Find the value of the test statistic. (Round your answer to two decimal places.)
Find the p-value. (Round your answer to three decimal places.)
p-value =
State your conclusion.
O Reject Ho. There is not sufficient evidence to conclude that there are differences among the mean unemployment rates for the four
geographic regions.
O Reject Ho. There is sufficient evidence to conclude that there are differences among the mean unemployment rates for the four
geographic regions.
O Do not reject Ho. There is not sufficient evidence to conclude that there are differences among the mean unemployment rates for the four
geographic regions.
O Do not reject Ho. There is sufficient evidence to conclude that there are differences among the mean unemployment rates for the four
geographic regions.
Expert Solution
This question has been solved!
Explore an expertly crafted, step-by-step solution for a thorough understanding of key concepts.

This is a popular solution

Trending nowThis is a popular solution!

Step by stepSolved in 1 steps with 1 images

Knowledge Booster

Similar questions
- 10.50arrow_forwardAsian economies impact some of the world's largest populations. The growth of an economy has a big influence on the everyday lives of ordinary people. Are Asian economies changing? A random sample of 15 Asian economies gave the following information about annual percentage growth rate. Region 1 2 3 4 5 6 7 8 Modern Growth Rate % 4.4 2.9 7.6 2.6 0.9 5.3 2.3 4.8 Historic Growth Rate 3.1 1.7 7.1 5.9 3.1 6.2 3.4 8.6 Region 9 10 11 12 13 14 15 Modern Growth Rate % 4.5 5.2 6.6 3.8 3.8 0.2 7.7 Historic Growth Rate 6.6 7.8 6.2 1.3 1.4 2.7 5.9 Does this information indicate a change (either way) in the growth rate of Asian economies? Use a 10% level of significance. (a) What is the level of significance? State the null and alternate hypotheses. Ho: Distributions are the same. H1: Distributions are different.Ho: Distributions are different. H1: Distributions are the same. Ho: Distributions are the same. H1: Distributions are the same.Ho: Distributions are different.…arrow_forwardReview this chart. Identify what type of figure/chart is presented and briefly explain what each chart is reporting.arrow_forward
- The number of adult Americans who smoke continues to drop. The table contains estimates of the percentages of adults (ages 1818 and over) who were smokers in the years between 1965 and 201715.and 201715. ???? ?Year � ??????? ?Smokers � 1965 41.94 1970 37.4 1974 37.1 1978 34.1 1980 33.2 1983 32.1 1985 30.1 1987 28.8 1990 25.5 1993 25.0 1995 24.7 1997 24.7 1999 23.5 2001 22.8 2002 22.5 2004 20.9 2006 20.8 2008 20.6 2010 19.3 2012 18.1 2014 16.8 2017 14.0 According to your regression line, how much did smoking decline per year during this period, on the average? Give your answer to three decimal places. average smoking decline: percentage pointsarrow_forwardThe mean birthweight of an infant is thought to be associated with the smoking status of the mother during the first trimester of the pregnancy. Consider the following data from mothers divided into four categories according to smoking habits, and the corresponding birthweights of their children. Group 1: Mother is a non smoker (NON): 7.5, 6.2, 6.9, 7.4, 9.2, 8.3, 7.6 Group 2: Mother is an ex-smoker (EX): 5.8, 7.3, 8.2, 7.1, 7.8 Group 3: Mother is a current smoker, smokes less than 1 pack per day (CUR < 1) 5.9, 6.2, 5.8, 4.7, 8.3, 7.2, 6.2 Group 4: Mother is a current smoker, smokes more than or equal to 1 pack per day (Cur ≥ 1) 6.2, 6.8, 5.7, 4.9, 6.2, 7.1, 5.8, 5.4 Using Stata test whether or not the mean birthweights are equal across all four groups at the alpha = 0.05 level. What are your null and alternative hypothesis? Ο HO: μ_1== μ_2 HA: μ_1=\= μ_2 O HO: μ_i== u_j for all i and j HA: μ_i=\= μ_j for all i and j O HO: μ_i == μ_j for all i and j HA: μ_i=\= μ_j for at least one i,j…arrow_forwardThe estimated labor cost associated with a particular proposal is based on the number of plantings of trees, shrubs, and so on to be used for the project. For cost-estimating purposes, managers use two hours of labor time for the planting of a medium-sized tree. Actual times from a sample of 10 plantings during the past month follow (times in hours). 1.6 1.5 2.6 2.3 2.5 2.3 2.6 3.0 1.3 2.3 What is the test statistic? (Round your answer to three decimal places.) What is the p-value? (Round your answer to four decimal places.) p-value =arrow_forward
- Asian economies impact some of the world's largest populations. The growth of an economy has a big influence on the everyday lives of ordinary people. Are Asian economies changing? A random sample of 15 Asian economies gave the following information about annual percentage growth rate. Region 1 2 3 4 5 6 7 8 Modern Growth Rate % 4.4 2.9 7.6 2.4 0.9 5.5 2.5 4.8 Historic Growth Rate 3.1 1.7 7.2 5.3 3.7 6.4 3.4 8.8 Region 9 10 11 12 13 14 15 Modern Growth Rate % 4.3 5.2 6.5 3.8 3.4 0.2 7.5 Historic Growth Rate 6.6 7.8 6.2 1.9 1.2 2.9 5.3 Does this information indicate a change (either way) in the growth rate of Asian economies? Use a 10% level of significance. Compute the sample test statistic. (Round your answer to two decimal places.) Find the P-value of the sample test statistic. (Round your answer to four decimal places.)arrow_forwardA sample of 35 liberal-arts graduates yielded the following starting annual salaries. Data are in thousands of dollars, rounded to the nearest hundred dollars. 49.0 45.8 50.3 49.6 50.0 47.7 51.8 47.3 46.7 47.0 48.1 50.1 43.6 48.0 47.7 49.8 46.4 46.1 48.5 48.9 48.2 48.1 46.2 47.3 51.7 49.0 48.2 49.9 48.1 49.8 49.5 50.4 45.3 45.3 46.5 Construct a stem-and-leaf plot on a separate sheet of paper and answer the following questions based on your plot. a) Yes or No, the stems range from 43 to 51, inclusive. b) Yes or No, The stem 44 has no values associated with it. c) Yes or No, There are no commas in my stem and leaf plot. c) What is the shape of the distribution?arrow_forwardThe price per share of stock for a sample of 25 companies was recorded at the beginning of the first financial quarter and then again at the end of the first financial quarter. How stocks perform during the first financial quarter is an indicator of what is ahead for the stock market and the economy. Company End of 1st quarter Beginning of 1st quarter Bank of New York Mellon 54.19 53.82 Kraft Foods 55.70 77.02 E.I. du Pont de Nemours and Company 102.57 109.00 Consolidated Edison 79.95 83.58 Johnson & Johnson 126.01 139.23 Union Pacific 132.73 135.78 Comcast 32.06 41.07 Applied Materials 50.91 53.04 Pfizer 35.40 36.44 General Electric 14.05 17.98 AT&T 32.54 38.54 Cisco Systems 44.83 38.86 Home Depot 184.63 188.03 JP Morgan Chase 108.78 107.95 Procter & Gamble 71.96 90.65 Verizon 48.82 53.53 Devon Energy 36.20 42.23 Lilly 79.07 84.68 Microsoft 95.00 85.95 Coca Cola 42.59 45.59 Qualcomm 50.82 65.20 Exxon Mobil Corporation 76.95…arrow_forward
arrow_back_ios
arrow_forward_ios
Recommended textbooks for you
- MATLAB: An Introduction with ApplicationsStatisticsISBN:9781119256830Author:Amos GilatPublisher:John Wiley & Sons Inc
 Probability and Statistics for Engineering and th...StatisticsISBN:9781305251809Author:Jay L. DevorePublisher:Cengage Learning
 Statistics for The Behavioral Sciences (MindTap C...StatisticsISBN:9781305504912Author:Frederick J Gravetter, Larry B. WallnauPublisher:Cengage Learning
  Elementary Statistics: Picturing the World (7th E...StatisticsISBN:9780134683416Author:Ron Larson, Betsy FarberPublisher:PEARSON
 The Basic Practice of StatisticsStatisticsISBN:9781319042578Author:David S. Moore, William I. Notz, Michael A. FlignerPublisher:W. H. Freeman
 Introduction to the Practice of StatisticsStatisticsISBN:9781319013387Author:David S. Moore, George P. McCabe, Bruce A. CraigPublisher:W. H. Freeman
MATLAB: An Introduction with Applications
Statistics
ISBN:9781119256830
Author:Amos Gilat
Publisher:John Wiley & Sons Inc
Probability and Statistics for Engineering and th...
Statistics
ISBN:9781305251809
Author:Jay L. Devore
Publisher:Cengage Learning
Statistics for The Behavioral Sciences (MindTap C...
Statistics
ISBN:9781305504912
Author:Frederick J Gravetter, Larry B. Wallnau
Publisher:Cengage Learning
Elementary Statistics: Picturing the World (7th E...
Statistics
ISBN:9780134683416
Author:Ron Larson, Betsy Farber
Publisher:PEARSON
The Basic Practice of Statistics
Statistics
ISBN:9781319042578
Author:David S. Moore, William I. Notz, Michael A. Fligner
Publisher:W. H. Freeman
Introduction to the Practice of Statistics
Statistics
ISBN:9781319013387
Author:David S. Moore, George P. McCabe, Bruce A. Craig
Publisher:W. H. Freeman