
MATLAB: An Introduction with Applications
6th Edition
ISBN: 9781119256830
Author: Amos Gilat
Publisher: John Wiley & Sons Inc
expand_more
expand_more
format_list_bulleted
Related questions
Question
thumb_up100%
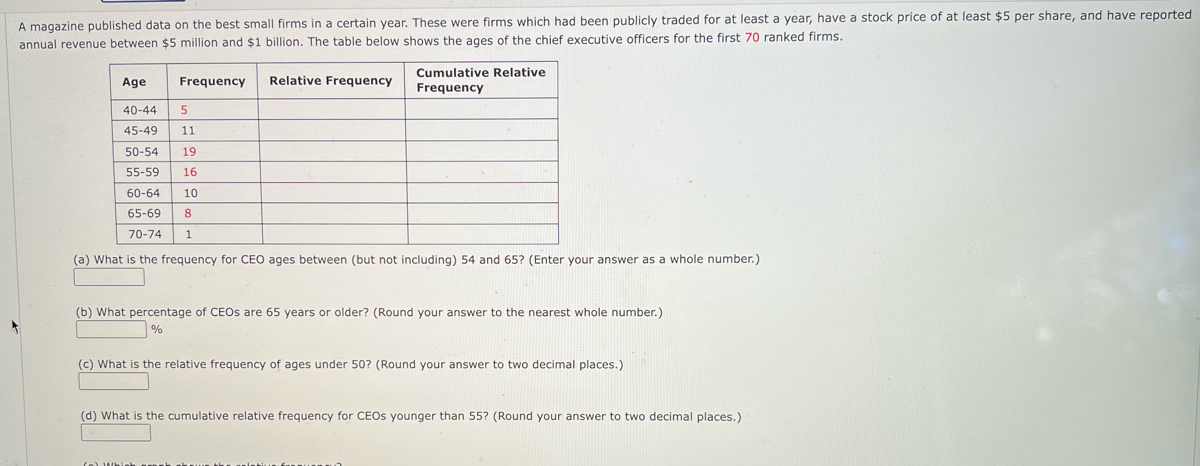

Transcribed Image Text:A magazine published data on the best small firms in a certain year. These were firms which had been publicly traded for at least a year, have a stock price of at least $5 per share, and have reported
annual revenue between $5 million and $1 billion. The table below shows the ages of the chief executive officers for the first 70 ranked firms.
Cumulative Relative
Age
Frequency
Relative Frequency
Frequency
40-44
45-49
11
50-54
19
55-59
16
60-64
10
65-69
8
70-74
(a) What is the frequency for CEO ages between (but not including) 54 and 65? (Enter your answer as a whole number.)
(b) What percentage of CEOS are 65 years or older? (Round your answer to the nearest whole number.)
%
(c) What is the relative frequency of ages under 50? (Round your answer to two decimal places.)
(d) What is the cumulative relative frequency for CEOS younger than 55? (Round your answer to two decimal places.)
Expert Solution
This question has been solved!
Explore an expertly crafted, step-by-step solution for a thorough understanding of key concepts.

Step by stepSolved in 2 steps with 1 images

Knowledge Booster

Similar questions
- Discrete Math Select 64 days in a year. At least how many days fall on the sameday of the week?arrow_forwardDescribe how the number of dots increases from Stage 1 to Stage 3.arrow_forwardWhich data set is exponential? (0, 0.1), (1, 0.5), (2, 2.5), (3, 12.5) (0, -1), (1, 0), (2, 7), (3, 20) (0, -1), (1, 0.5), (2, 2), (3, 3.5) (0, -1), (1, 2), (2, 11), (3, 26)arrow_forward
- Calculate IQRarrow_forwardPlease do not give solution in image format thankuarrow_forwards Activity-Chapter 3 Math 2600 2. The data below shows the percent vaccinated (for the flu) by age group (6 months to 17 years, 18 to 49 years of age, 50 - 64 years of age, and 65 years of age or older) in the United States for last year up to Feb. 2018. Answer the questions below. Reference: https://www.cdc.gov/nchs/fastats/flu.htm Vaccinated Identify the who. People vaccinated for flu, b. Which age group has the greater a. 09 percentage of those who got a flu vaccine? 65 and older. 50+ C. Which age group has the lowest 45.2 percentage of those who got a flu vaccine? 18-49yr age group 31.8 d. Approximately 48.1 million Americans are 65 years old or older. According to this value, how many 65 and older Americans actually got the flu vaccine during this time 301 201 period? Just because the 65 and older category had the greater percentage, does that also mean the 65 and older group has the most 6 mos to 17 yrs 18 to 49 yrs 50 64 yrs 65 and older Age Group people getting vaccinated?…arrow_forward
arrow_back_ios
SEE MORE QUESTIONS
arrow_forward_ios
Recommended textbooks for you
- MATLAB: An Introduction with ApplicationsStatisticsISBN:9781119256830Author:Amos GilatPublisher:John Wiley & Sons Inc
 Probability and Statistics for Engineering and th...StatisticsISBN:9781305251809Author:Jay L. DevorePublisher:Cengage Learning
 Statistics for The Behavioral Sciences (MindTap C...StatisticsISBN:9781305504912Author:Frederick J Gravetter, Larry B. WallnauPublisher:Cengage Learning
  Elementary Statistics: Picturing the World (7th E...StatisticsISBN:9780134683416Author:Ron Larson, Betsy FarberPublisher:PEARSON
 The Basic Practice of StatisticsStatisticsISBN:9781319042578Author:David S. Moore, William I. Notz, Michael A. FlignerPublisher:W. H. Freeman
 Introduction to the Practice of StatisticsStatisticsISBN:9781319013387Author:David S. Moore, George P. McCabe, Bruce A. CraigPublisher:W. H. Freeman
MATLAB: An Introduction with Applications
Statistics
ISBN:9781119256830
Author:Amos Gilat
Publisher:John Wiley & Sons Inc
Probability and Statistics for Engineering and th...
Statistics
ISBN:9781305251809
Author:Jay L. Devore
Publisher:Cengage Learning
Statistics for The Behavioral Sciences (MindTap C...
Statistics
ISBN:9781305504912
Author:Frederick J Gravetter, Larry B. Wallnau
Publisher:Cengage Learning
Elementary Statistics: Picturing the World (7th E...
Statistics
ISBN:9780134683416
Author:Ron Larson, Betsy Farber
Publisher:PEARSON
The Basic Practice of Statistics
Statistics
ISBN:9781319042578
Author:David S. Moore, William I. Notz, Michael A. Fligner
Publisher:W. H. Freeman
Introduction to the Practice of Statistics
Statistics
ISBN:9781319013387
Author:David S. Moore, George P. McCabe, Bruce A. Craig
Publisher:W. H. Freeman