
Chemistry
10th Edition
ISBN: 9781305957404
Author: Steven S. Zumdahl, Susan A. Zumdahl, Donald J. DeCoste
Publisher: Cengage Learning
expand_more
expand_more
format_list_bulleted
Related questions
Question
thumb_up100%
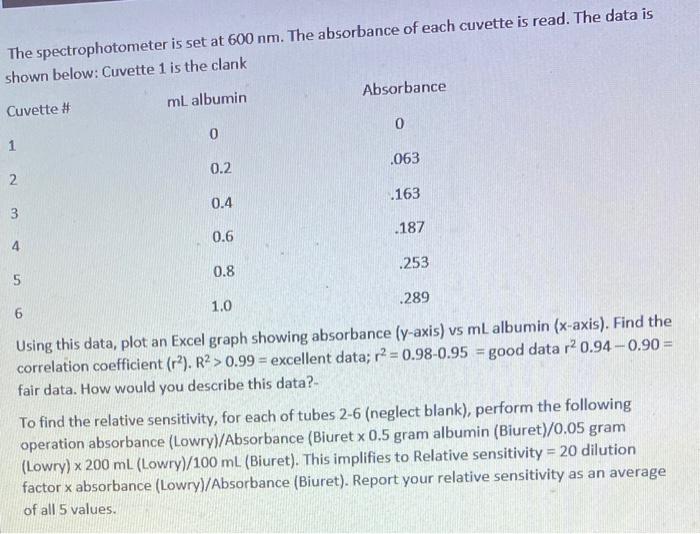

Transcribed Image Text:The spectrophotometer is set at 600 nm. The absorbance of each cuvette is read. The data is
shown below: Cuvette 1 is the clank
Cuvette #
ml albumin
Absorbance
0.
0.2
.063
3
0.4
.163
4.
0.6
.187
0.8
.253
1.0
.289
Using this data, plot an Excel graph showing absorbance (y-axis) vs ml albumin (x-axis). Find the
correlation coefficient (r). R2 > 0.99 = excellent data; r2 0.98-0.95 good data r2 0.94 -0.90 =
fair data. How would you describe this data?-
To find the relative sensitivity, for each of tubes 2-6 (neglect blank), perform the following
operation absorbance (Lowry)/Absorbance (Biuret x 0.5 gram albumin (Biuret)/0.05 gram
(Lowry) x 200 ml (Lowry)/100 mL (Biuret). This implifies to Relative sensitivity = 20 dilution
factor x absorbance (Lowry)/Absorbance (Biuret). Report your relative sensitivity as an average
of all 5 values.
Expert Solution
This question has been solved!
Explore an expertly crafted, step-by-step solution for a thorough understanding of key concepts.

Step by stepSolved in 3 steps with 3 images

Knowledge Booster


Learn more about
Need a deep-dive on the concept behind this application? Look no further. Learn more about this topic, chemistry and related others by exploring similar questions and additional content below.Similar questions
- Based on the data, calculate the concentration of analyte in the ORIGINAL sample in ppm. Report to 1 decimal place Sample: A 10.00 mL aliquot of the unknown was placed in a 100.0 mL volumetric flask and made up to the mark will distilled water. The absorbance of this solution is 0.185. Sample + Spike: A 10.00 mL aliquot of the unknown and a 13.00 mL aliquot of the 46.00 ppm stock were both placed in the same 100.0 mL volumetric flask and diluted to the mark with water. The absorbance of this solution is 0.326. ( Please type answer note write by hend)arrow_forwardCalculate the concentration of unknown red dye solution solution is not =12.9,134,12.55,0.34arrow_forwardCalculate the concentration of unknown red dye solutionarrow_forward
- * Question Completion Status: QUESTION 6 Most analytical machines used in science can either measure absorbance of light, like the spectrophotometers used in BioZ 151 and 152 labs, or can measure change in electrical conductance. In order to convert things like absorbance values into concentration data, a linear regression is used. In order to determine nitrite concentration in water samples, nitrite is reacted with several chemicals to produce a purple color. The absorbance of the solution is measured from known amounts of nitrite to produce a standard curve to analyze samples. Use the data in the provided table, or from the linked spreadsheet to make a graph and perform a linear regression using treadline. mg/L NO, Absorbance 0.1 0.183 0.3 0.5 0.7 0.542 0.914 1.298 1.61 In order for this to work, samples must be diluted prior to measurement standard curve. If a sample underwent a 0.02 dilution, and produce an absorbance value of 0.903, what is the resultant concentration of NO2 in mg…arrow_forwardThe concentration of methylene blue in the sample is estimated through (select the correct) options: refractive index measurement (refractometry). turbidity measurement (turbidimetry). absorbance measurement (spectrophotometry). titration with 2% HCl solution.arrow_forwardA student weighed out 0.150 g of protein powder and dissolved it in 100 mL of water (Solution 1). The student then diluted this solution by transferring 1 mL into a 25 mL flask and diluting with water (Solution 2). Finally, 1 mL of that solution was transferred to a test tube and combined with 4 mL Bradford reagent. The absorbance of the solution in the test tube was 0.187. Assuming that the best fit linear line of the standard curve was y = 0.04144 x + 0.01521 (μ g mL), calculate the percent protein by mass in the original protein powder.arrow_forward
- A solution containing a mixture of the compounds X and Y had an absorbance of 0.814 at 443 nm and an absorbance of 0.699 at 520 nm when measured with a 1.00 cm cell. The molar absorptivities (e) of X and Y at each wavelength are shown in the table. [X] = Wavelength (2, nm) [Y] = 443 Incorrect 520 2.13 x10⁻⁵ 1.23 x10⁻⁴ Incorrect Molar Absorptivity (c. M-¹cm-¹) X What are the concentrations of X and Y in this mixture? 16180 3936 Y 3817 6333 4 M Marrow_forwardHow do you convert absorbance to µmoles?arrow_forwardSel Absorbance S Verify your molar absorptivity value. Did you report your data to the correct number of significant figures? Analytical wavelength Analytical wavelength for blue dye (nm) Calibration curve Solution 1 2 3 4 5 Dye concentration (μM) 15.20 7.51 Unknown solution 3.74 1.89 1.01 Molar absorptivity (μM ¹cm-¹) Absorbance Concentration of unknown blue dye (µM) 629 Absorbance 0.756 0.432 0.259 0.175 0.144 0.083 How to calculate concentration from absorbance S A d tra 01arrow_forward
- After creating her standard curve for absorption versus the concentration (M) of FD&C Red 40, a student found that her best fit linear line for FD&C Red 40 was y = 2,962x + 0.005. Her Kool-Aid sample had an absorbance of 0.685. If 0.543 grams of Kool-Aid powder was used to prepare an 8-fl oz cup of her assigned flavor, what is the percent by mass of FD&C Red 40 in her 8-fl oz cup?arrow_forwardAfter determining the absorbance of several standards of known concentration, the trendline for a calibration curve (AKA a standard curve) plotting absorbance (y-axis) against concentration (M, x-axis) is determined to be y = 4.586x + -0.0010 %3D The absorbance of a solution of unknown concentration is determined to be 0.68. Calculate the concentration of the unknown solution in M. Give your answer to thrėe decimal places.arrow_forwardHow would I do 2? the concentration iron is 1.85mg/vitamin tablet, and the absorbance at 508nm is 0.37arrow_forward
arrow_back_ios
SEE MORE QUESTIONS
arrow_forward_ios
Recommended textbooks for you
- ChemistryChemistryISBN:9781305957404Author:Steven S. Zumdahl, Susan A. Zumdahl, Donald J. DeCostePublisher:Cengage Learning
 ChemistryChemistryISBN:9781259911156Author:Raymond Chang Dr., Jason Overby ProfessorPublisher:McGraw-Hill Education
 Principles of Instrumental AnalysisChemistryISBN:9781305577213Author:Douglas A. Skoog, F. James Holler, Stanley R. CrouchPublisher:Cengage Learning
  Organic ChemistryChemistryISBN:9780078021558Author:Janice Gorzynski Smith Dr.Publisher:McGraw-Hill Education
 Chemistry: Principles and ReactionsChemistryISBN:9781305079373Author:William L. Masterton, Cecile N. HurleyPublisher:Cengage Learning
 Elementary Principles of Chemical Processes, Bind...ChemistryISBN:9781118431221Author:Richard M. Felder, Ronald W. Rousseau, Lisa G. BullardPublisher:WILEY
Chemistry
Chemistry
ISBN:9781305957404
Author:Steven S. Zumdahl, Susan A. Zumdahl, Donald J. DeCoste
Publisher:Cengage Learning
Chemistry
Chemistry
ISBN:9781259911156
Author:Raymond Chang Dr., Jason Overby Professor
Publisher:McGraw-Hill Education
Principles of Instrumental Analysis
Chemistry
ISBN:9781305577213
Author:Douglas A. Skoog, F. James Holler, Stanley R. Crouch
Publisher:Cengage Learning
Organic Chemistry
Chemistry
ISBN:9780078021558
Author:Janice Gorzynski Smith Dr.
Publisher:McGraw-Hill Education
Chemistry: Principles and Reactions
Chemistry
ISBN:9781305079373
Author:William L. Masterton, Cecile N. Hurley
Publisher:Cengage Learning
Elementary Principles of Chemical Processes, Bind...
Chemistry
ISBN:9781118431221
Author:Richard M. Felder, Ronald W. Rousseau, Lisa G. Bullard
Publisher:WILEY