MATLAB: An Introduction with Applications
6th Edition
ISBN: 9781119256830
Author: Amos Gilat
Publisher: John Wiley & Sons Inc
expand_more
expand_more
format_list_bulleted
Question
Proportion Inferences from Simulations

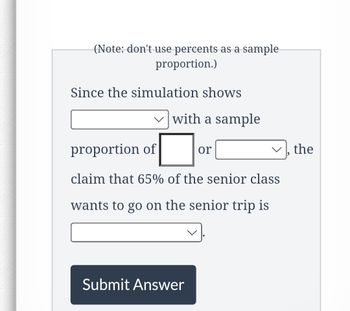
Transcribed Image Text:(Note: don't use percents as a sample
proportion.)
Since the simulation shows
with a sample
proportion of
claim that 65% of the senior class
wants to go on the senior trip is
Submit Answer
or
the

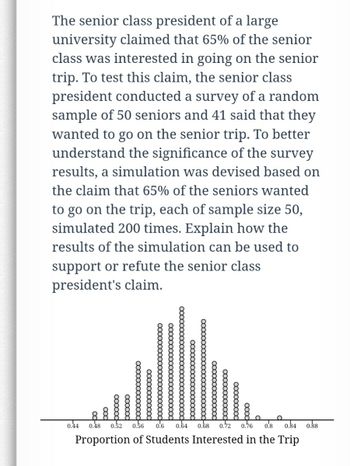
Transcribed Image Text:The senior class president of a large
university claimed that 65% of the senior
class was interested in going on the senior
trip. To test this claim, the senior class
president conducted a survey of a random
sample of 50 seniors and 41 said that they
wanted to go on the senior trip. To better
understand the significance of the survey
results, a simulation was devised based on
the claim that 65% of the seniors wanted
to go on the trip, each of sample size 50,
simulated 200 times. Explain how the
results of the simulation can be used to
support or refute the senior class
president's claim.
booooo
oooooo
xoooooooooooo
xxxxxxx
0.44 0.48
0.52 0.56 0.6 0.64 0.68 0.72 0.76 0.8 0.84 0.88
Proportion of Students Interested in the Trip
Expert Solution
This question has been solved!
Explore an expertly crafted, step-by-step solution for a thorough understanding of key concepts.
This is a popular solution
Trending nowThis is a popular solution!
Step by stepSolved in 3 steps

Knowledge Booster
Similar questions
- TSS tells us: Group of answer choices The proportion of variation in the LHS variable we are explaining through variation in the RHS variable The total variation in the LHS variable we would like to explain The proportion of RHS variable variation we are failing to explain If our model has a good fit or not None of the above are correctarrow_forwardBad model? A student who has created a linear model isdisappointed to find that her R2 value is a very low 13%.a) Does this mean that a linear model is not appropriate?Explain.b) Does this model allow the student to make accuratepredictions? Explain.arrow_forwardLinear Regression Problem (See the data table) Please refer to the table on the last page to answer this problem The table displays the average global temperature in degrees celcius relative to the year 2000 in five year intervals. What relationship are you interested in studying? Identify the independent and dependent variables. How many data points were collected? Was sampling conducted? Draw a bubble diagram showing the relationship between the variables, include the effects of a confounding variable on your diagram.arrow_forward
- Chapter 11 Worksheet on Regression Name Consider an experiment designed to estimate the linear relationship between the percentage of a certain drug in the bloodstream of a subject and the length of time it takes the subject to react to a stimulus. In particular, the researchers want to predict reaction time based on the amount of drug in the bloodstream. Give a practical interpretation of the slope. Give a practical interpretation of the coefficient of correlation. What percentage of the sample variation in y can be explained by x in the simple linear model? REACTIO PERCENT N TIME 4.5 XOF IN 4 DRUG SECONDS 3.5 y=0.7x-0.1 R = 0.8167/ 2 2.5 3 4 1.5 1 0.5 r^2=.8167 From Excelarrow_forwardThe mathematical equation relating the independent variable to the expected value of the dependent variable; that is, E(y) = b0 + b1x, is known as the? estimated regression equation. correlation model. regression equation. regression model.arrow_forward[STATISTICS] How do you solve this?arrow_forward
- [STATISTICS] How do you solve this? Data set: https://docs.google.com/document/d/18i0t_5Epc5KbGW5X659fLQID0zEOSIZIFMOIgHqEuos/edit?usp=sharingarrow_forwardEstimation of PROPORTION: What percent of people prefer chocolate ice cream over vanilla? At a popular ice cream stand, 250 customers in a day ordered a single flavored ice cream cone and 120 were chocolate. Use 95% CL. P-hat ______________ Margin of Error ____________ _______________ < P < _____________arrow_forwardThe mathematical equation relating the independent variable to the expected value of the dependent variable that is, E(y) = ?0 + ?1x, is known as the correlation model. regression equation. estimated regression equation.regression model.arrow_forward
arrow_back_ios
arrow_forward_ios
Recommended textbooks for you
 MATLAB: An Introduction with ApplicationsStatisticsISBN:9781119256830Author:Amos GilatPublisher:John Wiley & Sons Inc
 Probability and Statistics for Engineering and th...StatisticsISBN:9781305251809Author:Jay L. DevorePublisher:Cengage Learning
 Statistics for The Behavioral Sciences (MindTap C...StatisticsISBN:9781305504912Author:Frederick J Gravetter, Larry B. WallnauPublisher:Cengage Learning
 Elementary Statistics: Picturing the World (7th E...StatisticsISBN:9780134683416Author:Ron Larson, Betsy FarberPublisher:PEARSON
 The Basic Practice of StatisticsStatisticsISBN:9781319042578Author:David S. Moore, William I. Notz, Michael A. FlignerPublisher:W. H. Freeman
 Introduction to the Practice of StatisticsStatisticsISBN:9781319013387Author:David S. Moore, George P. McCabe, Bruce A. CraigPublisher:W. H. Freeman

MATLAB: An Introduction with Applications
Statistics
ISBN:9781119256830
Author:Amos Gilat
Publisher:John Wiley & Sons Inc

Probability and Statistics for Engineering and th...
Statistics
ISBN:9781305251809
Author:Jay L. Devore
Publisher:Cengage Learning

Statistics for The Behavioral Sciences (MindTap C...
Statistics
ISBN:9781305504912
Author:Frederick J Gravetter, Larry B. Wallnau
Publisher:Cengage Learning

Elementary Statistics: Picturing the World (7th E...
Statistics
ISBN:9780134683416
Author:Ron Larson, Betsy Farber
Publisher:PEARSON

The Basic Practice of Statistics
Statistics
ISBN:9781319042578
Author:David S. Moore, William I. Notz, Michael A. Fligner
Publisher:W. H. Freeman

Introduction to the Practice of Statistics
Statistics
ISBN:9781319013387
Author:David S. Moore, George P. McCabe, Bruce A. Craig
Publisher:W. H. Freeman