MATLAB: An Introduction with Applications
6th Edition
ISBN: 9781119256830
Author: Amos Gilat
Publisher: John Wiley & Sons Inc
expand_more
expand_more
format_list_bulleted
Question

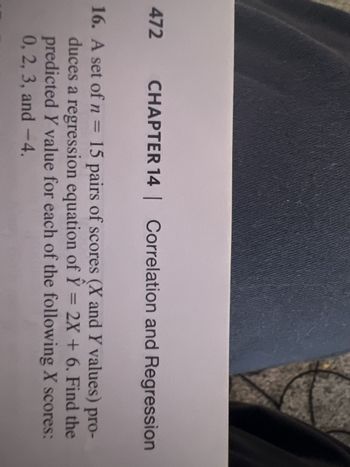
Transcribed Image Text:472
er
CHAPTER 14 | Correlation and Regression
16. A set of n = 15 pairs of scores (X and Y values) pro-
duces a regression equation of Y = 2X + 6. Find the
predicted Y value for each of the following X scores:
0, 2, 3, and -4.
Expert Solution
This question has been solved!
Explore an expertly crafted, step-by-step solution for a thorough understanding of key concepts.
This is a popular solution
Trending nowThis is a popular solution!
Step by stepSolved in 2 steps with 1 images

Knowledge Booster
Similar questions
- I’m taking a statistics and probability class. Please get this correct because I want to learn. I have gotten wrong answers on here beforearrow_forward1.)fill in the blanks. Based on the physician's study, the predictor variable, X is_____and the response variable, Y, is________. 2.) As described in the article, the relation between age and peak heart is a______. - positive relation - negative relation - no relation 3.) Provide the regression line, ŷ=a+bx. Show steps/equations used to get answer. 4.) Suppose a 40 year old person is randomely selected. Use your Model to predict their peak heart rate. 5.) Based on your model, as a person ages one year, how much would you expect peak heart rate to change?arrow_forwardThe correlation coefficient between midterm and final scores in a large statistics class is r=0.6. A scatterplot of the two variables is football shaped. A particular student has a midterm score that is 0.5 SDs below the average midterm score of all students. Using regression, we would predict that the student's final score is _________ SDs _________ the average final score of all students and therefore at the _________ percentile of final scores of all students.arrow_forward
- Part 2: Regression Based on the correlation you ran to assess the relationship between # of exposures and perceived connection strength recalled, please carry out the steps to determine the equation for the regression line (or best-fitting line) а. Step 1: find the slope and y-intercept b. Step 2: Using these values, write the equation for the best fitting line, but make sure to write it in terms of the specific predictor (X) and predicted (Y) variables of interest. In other words, your equation should use variable names “# of exposures" and "perceived strength of connection rating", rather than X and Y. Using the regression equation, please predict the perceived connection strength score for a student exposed subliminally to the stranger's face seven times. Make sure to show your work с. d. Using the regression equation, draw the line of best fit on your scatterplot. Please use at least 3 points to anchor your line and show your work.arrow_forwardx = number of traffic tickets y = Cost of auto insurance A test of linear correlation between traffic tickets and insurance cost produces a linear correlation coefficient of r = 0.705. Determine weather the regression line has a positive slope, or a negative slopearrow_forward13/arrow_forward
- What is the regression linearrow_forwardplease answer the question and show work!! thank you also please make sure if writing on paper handwriting can be read thank you again :)arrow_forwardIn a fisheries researchers experiment the correlation between the number of eggs in tge nest and the number of viable (surviving ) eggs for a sample of nests is r=0.67 the equation of the regression line for number of viable eggs y versus number of eggs in the nest x is y =0.72x + 17.07 for a nest with 140 eggs what is the predicted number of viable eggs ?arrow_forward
- hi would you please help me solve this question?arrow_forwardData Set: {(-3, 4), (-2, 3), (–1,3), (0, 7), (1, 5), (2, 6), (3, 1)} 1. The regression line is: y = when the 2. Based on the regression line, we would expect the value of response variable to be explanatory variable is 0. 3. For each increase of 1 in of the explanatory variable, we can expect a(n) in the response variable. 4. If x = -3.5, the y = This is an example of 5. The correlation coefficient is r = (Round to the nearest hundredth.) Check ofarrow_forward
arrow_back_ios
arrow_forward_ios
Recommended textbooks for you
 MATLAB: An Introduction with ApplicationsStatisticsISBN:9781119256830Author:Amos GilatPublisher:John Wiley & Sons Inc
 Probability and Statistics for Engineering and th...StatisticsISBN:9781305251809Author:Jay L. DevorePublisher:Cengage Learning
 Statistics for The Behavioral Sciences (MindTap C...StatisticsISBN:9781305504912Author:Frederick J Gravetter, Larry B. WallnauPublisher:Cengage Learning
 Elementary Statistics: Picturing the World (7th E...StatisticsISBN:9780134683416Author:Ron Larson, Betsy FarberPublisher:PEARSON
 The Basic Practice of StatisticsStatisticsISBN:9781319042578Author:David S. Moore, William I. Notz, Michael A. FlignerPublisher:W. H. Freeman
 Introduction to the Practice of StatisticsStatisticsISBN:9781319013387Author:David S. Moore, George P. McCabe, Bruce A. CraigPublisher:W. H. Freeman

MATLAB: An Introduction with Applications
Statistics
ISBN:9781119256830
Author:Amos Gilat
Publisher:John Wiley & Sons Inc

Probability and Statistics for Engineering and th...
Statistics
ISBN:9781305251809
Author:Jay L. Devore
Publisher:Cengage Learning

Statistics for The Behavioral Sciences (MindTap C...
Statistics
ISBN:9781305504912
Author:Frederick J Gravetter, Larry B. Wallnau
Publisher:Cengage Learning

Elementary Statistics: Picturing the World (7th E...
Statistics
ISBN:9780134683416
Author:Ron Larson, Betsy Farber
Publisher:PEARSON

The Basic Practice of Statistics
Statistics
ISBN:9781319042578
Author:David S. Moore, William I. Notz, Michael A. Fligner
Publisher:W. H. Freeman

Introduction to the Practice of Statistics
Statistics
ISBN:9781319013387
Author:David S. Moore, George P. McCabe, Bruce A. Craig
Publisher:W. H. Freeman