MATLAB: An Introduction with Applications
6th Edition
ISBN: 9781119256830
Author: Amos Gilat
Publisher: John Wiley & Sons Inc
expand_more
expand_more
format_list_bulleted
Question
thumb_up100%

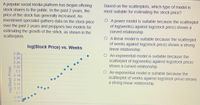
Transcribed Image Text:A popular social media platform has begun offering
stock shares to the public. In the past 2 years, the
price of the stock has generally increased. An
investment specialist gathers data on the stock price
over the past 2 years and proppses two models for
estimating the growth of the steck, as shown in the
scatterplots.
Based on the scatterplots, which type of model is
most suitable for estimating the stock price?
O A power model is suitable because the scatterplot
of log(weeks) against log(stock price) shows a
curved relationship.
O A linear model is suitable because the scatterplot
of weeks against log(stock price) shows a strong
linear relationship.
log(Stock Price) vs. Weeks
O An exponential model is suitable because the
scatterplot of log(weeks) against log(stock price)
shows a curved relationship.
2.28
2.26
2.24
222
2.2
2.18
2.16
2.14
212
O An exponential model is suitable because the
scatterplot of weeks against log(stock price) shows
a strong linear relationship.
2.1
2.08
206
log(Stock Price)

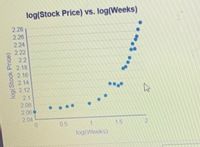
Transcribed Image Text:log(Stock Price) vs. log(Weeks)
2.28
2.26
2.24
2.22
22
2.18
2.16
2.14
2.12
21
2.08
2.06
2.04
0.5
1.
1.5
12,
log(Weeks)
log(Stock Price)
Expert Solution
This question has been solved!
Explore an expertly crafted, step-by-step solution for a thorough understanding of key concepts.
This is a popular solution
Trending nowThis is a popular solution!
Step by stepSolved in 2 steps

Knowledge Booster
Learn more about
Need a deep-dive on the concept behind this application? Look no further. Learn more about this topic, statistics and related others by exploring similar questions and additional content below.Similar questions
- Canada's trade balance with the rest of the world has been steadily increasing over the past several years. It is well known that the U.S. is Canada's leading trade partner. Is there a predictable linear relationship between our total trade balance and our trade balance with the U.S.? Develop a regression model to predict the trade balance with the U.S. by our trade balance with the rest of the world. Comment on the strength of the model. Develop a time-series trend line for trade balance with the rest of the world by using the time periods given. Forecast total trade balance with the rest of the world for 2020 using this equation. Trade Balance ($ millions) Year Rest of the World U.S. 2010 2,290 4,991 2011 2,486 4,709 2012 2,776 4,641 2013 2,648 5,220 2014 3,068 5,041 2015 3,688 4,750 2016 4,111 4,321 2017 4,172 4,699 2018 3,669 4,777 2019 3,493 4,809 question 1: y̅ = ?+?x question…arrow_forwardYou estimate a regression equation that estimates individuals’ yearly income as a function of age (measured in years), years of education, and their score on a standardized intelligence exam (IQ test). The estimated coefficients are: I = 26.3 + 4.21*Age + 7.21*Education + .23 * IQ Where I is income measured in thousands of dollars. Based on the regression results, how much more should an individual earn after attending graduate school for two years? Explain your reasoning.arrow_forwardA popular television show recently released a video previewing the upcoming season on his website as fans of the show discovered the video the number of views of the preview video has grown each day during the last two weeks the number of days in the release of the video and the natural log of the number of video views as shown in the scatterplot. based on the scatterplot and residual plot, what type of model would be appropriate for summarizing the relationship between days and numbers of views? an exponential model is appropriate because the Residual plot does not show a clear pattern A linear model is appropriate because of scatterplot shows a strong positive linear relationship A power model is appropriate because the scatterplot of days a natural log of use is strong and linear an exponential model is appropriate because the relationship between the days in the natural log of views in linear and the residual plot does not show a clear patternarrow_forward
- Please help me this question.arrow_forwardDescribe three approaches to modeling seasonality in a regression forecast.arrow_forwardPlot the sales revenue figures and appropriate trend line on a graph and identify from this the choice of model for working out the seasonal component. Using the appropriate seasonal model, complete the calculations that are required to produce the required forecasts for quarters 1, 2, 3 and 4 of 2021. On the basis of your analysis explain the recommendation that you would make to ALAW Ltd regarding its future plans.arrow_forward
- Pison/&user=tmorrison7&key%3DrotNBBCzVIsGRqZV8t.. Previous Problem Problem List Next Problem (1 point) Empathy means being able to understand what others feel. To see how the brain expresses empathy, researchers recruited 16 couples in their midtwenties who were married or had been dating for at least two years. They zapped the man's hand with an electrode while the woman watched, and measured the activity in several parts of the woman's brain that would respond to her own pain. Brain activity was recorded as a fraction of the activity observed when the woman herself was zapped with the electrode. The women also completed a psychological test that measures empathy. Subject 1 3 4 7 8 9 10 11 12 13 14 15 16 Empathy Score 41 48 39 56 64 63 59 53 Brain Activity -0.127 0.3910.02 0.378 0.015 0.404 0.11 0.513 0.149 0.736 0.254 0.573 0.217 0.72 0.355 0.786 47 52 64 73 12 68 28 120 1.2 sub ject Z F20 10,0 120 -8.4 Given that the equation for the regression line is y = 0.00619x +0.00032, what is…arrow_forwardAn economist at Nedbank ran a study of the relationship between FTSE/JSE All Shares index return (JALSH) and consumer price index (CPI) from 2006 to 2017, the data collected is shown in the Table 1 below. FTSE/JSE All Shares index return (JALSH) and consumer price index (CPI) from 2006 to 2017. Year JALSH (Y) CPI (X) 2006 0.41 4.7 2007 0.19 7.1 2008 -0.23 11.5 2009 0.32 7.1 2010 0.19 4.3 2011 0.03 5.0 2012 0.27 5.6 2013 0.21 5.7 2014 0.11 6.1 2015 0.05 4.6 2016 0.00 6.4 2017 0.21 5.3 The estimated regression…arrow_forward
arrow_back_ios
arrow_forward_ios
Recommended textbooks for you
 MATLAB: An Introduction with ApplicationsStatisticsISBN:9781119256830Author:Amos GilatPublisher:John Wiley & Sons Inc
 Probability and Statistics for Engineering and th...StatisticsISBN:9781305251809Author:Jay L. DevorePublisher:Cengage Learning
 Statistics for The Behavioral Sciences (MindTap C...StatisticsISBN:9781305504912Author:Frederick J Gravetter, Larry B. WallnauPublisher:Cengage Learning
 Elementary Statistics: Picturing the World (7th E...StatisticsISBN:9780134683416Author:Ron Larson, Betsy FarberPublisher:PEARSON
 The Basic Practice of StatisticsStatisticsISBN:9781319042578Author:David S. Moore, William I. Notz, Michael A. FlignerPublisher:W. H. Freeman
 Introduction to the Practice of StatisticsStatisticsISBN:9781319013387Author:David S. Moore, George P. McCabe, Bruce A. CraigPublisher:W. H. Freeman

MATLAB: An Introduction with Applications
Statistics
ISBN:9781119256830
Author:Amos Gilat
Publisher:John Wiley & Sons Inc

Probability and Statistics for Engineering and th...
Statistics
ISBN:9781305251809
Author:Jay L. Devore
Publisher:Cengage Learning

Statistics for The Behavioral Sciences (MindTap C...
Statistics
ISBN:9781305504912
Author:Frederick J Gravetter, Larry B. Wallnau
Publisher:Cengage Learning

Elementary Statistics: Picturing the World (7th E...
Statistics
ISBN:9780134683416
Author:Ron Larson, Betsy Farber
Publisher:PEARSON

The Basic Practice of Statistics
Statistics
ISBN:9781319042578
Author:David S. Moore, William I. Notz, Michael A. Fligner
Publisher:W. H. Freeman

Introduction to the Practice of Statistics
Statistics
ISBN:9781319013387
Author:David S. Moore, George P. McCabe, Bruce A. Craig
Publisher:W. H. Freeman