
MATLAB: An Introduction with Applications
6th Edition
ISBN: 9781119256830
Author: Amos Gilat
Publisher: John Wiley & Sons Inc
expand_more
expand_more
format_list_bulleted
Related questions
Question
thumb_up100%
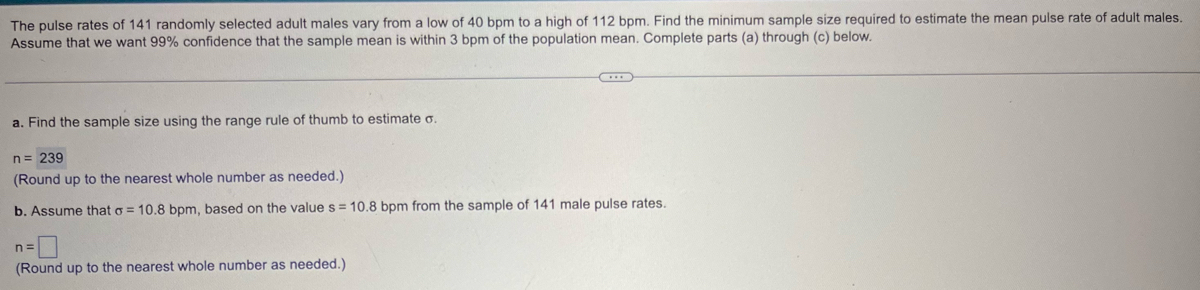

Transcribed Image Text:The pulse rates of 141 randomly selected adult males vary from a low of 40 bpm to a high of 112 bpm. Find the minimum sample size required to estimate the mean pulse rate of adult males.
Assume that we want 99% confidence that the sample mean is within 3 bpm of the population mean. Complete parts (a) through (c) below.
a. Find the sample size using the range rule of thumb to estimate σ.
n = 239
(Round up to the nearest whole number as needed.)
b. Assume that σ = 10.8 bpm, based on the values = 10.8 bpm from the sample of 141 male pulse rates.
n =
(Round up to the nearest whole number as needed.)
Expert Solution
This question has been solved!
Explore an expertly crafted, step-by-step solution for a thorough understanding of key concepts.

Step by stepSolved in 2 steps

Knowledge Booster

Similar questions
- I need help with thisarrow_forwardYou receive a brochure from a large university. The brochure indicates that the mean class size for full-time faculty is fewer than 32 students. You want to test this claim. You randomly select 18 classes taught by full-time faculty and determine the class size of each. The results are shown in the table below. At a= 0.10, can you support the university's claim? Complete parts (a) through (d) below. Assume the population is normally distributed. 32 31 26 31 34 41 25 24 290 27 30 33 30 29 28 30 25 23 OD. Ho p 32 Ha p2 32 Ha p< 32 Ha us 32 (b) Use technology to find the P-value. P = (Round to three decimal places as needed.) Enter your answer in the answer box and then click Check Answer.arrow_forwardYou receive a brochure from a large university. The brochure indicates that the mean class size for full-time faculty is fewer than 31 students. You want to test this claim. You randomly select 18 classes taught by full-time faculty and determine the class size of each. The results are shown in the table below. At a = 0.10, can you support the university's claim? Complete parts (a) through (d) below. Assume the population is normally distributed. 34 27 26 35 29 39 25 26 290 28 28 34 30 32 28 29 26 24 (a) Write the claim mathematically and identify Ho and Ha. Which of the following correctly states Ho and H3? O A. Ho: H= 31 B. Ho, μs 31 O c. Ho : μ= 3 Ha: H#31 Ha: u> 31 Ha: H31 OF. Ho: H231 Ha: u231 Ha: us 31 Ha: µ<31 (b) Use technology to find the P-value. P = (Round to three decimal places as needed.) (c) Decide whether to reject or fail to reject the null hypothesis. Which of the following is correct? O A. Reject Ho because the P-value is less than the significance level. O B. Fail…arrow_forward
- You receive a brochure from a large university. The brochure indicates that the mean class size for full-time faculty is fewer than 31 students. You want to test this claim. You randomly select 18 classes taught by full-time faculty and determine the class size of each. The results are shown in the table below. At a = 0.05, can you support the university's claim? Complete parts (a) through (d) below. Assume the population is normally distributed Ha μ#31 33 26 (b) Use technology to find the P-value. 25 30 28 38 33 36 H₂ μ31 EN 25 28 310 24arrow_forwardDetermine the minimum sample size required when you want to be 99% confident that the sample mean is within one unit of the population mean and σ=12.3. Assume the population is normally distributed.arrow_forwardThe pulse rates of 153 randomly selected adult males vary from a low of 35 bpm to a high of 99 bpm. Find the minimum sample size required to estimate the mean pulse rate of adult males. Assume that we want 95% confidence that the sample mean is within 3 bpm of the population mean. Complete parts (a) through (c) below. a. Find the sample size using the range rule of thumb to estimate ơ. n = (Round up to the nearest whole number as needed.) b. Assume that o = 12.3 bpm, based on the value s = 12.3 bpm from the sample of 153 male pulse rates. n = (Round up to the nearest whole number as needed.) c. Compare the results from parts (a) and (b). Which result is likely to be better? The result from part (a) is the result from part (b). The result from is likely to be better because Enter your answer in each of the answer boxes. ? MacBook 乡 DII DD F12 000 000 80 F9 F10 F11 F6 F7 F8 esc F3 F4 F5 F1 F2 & ( ) ! @ # 2$ 2 3 4 5 7 8 9 1 { P W E R Y U [ + IIarrow_forward
- Use the Central Limit Theorem to find the mean and standard error of the mean of the sampling distribution. Then sketch a graph of the sampling distribution. The mean price of photo printers on a website is $229 with a standard deviation of $63. Random samples of size 24 are drawn from this population and the mean of each sample is determined. The mean of the distribution of sample means isarrow_forwardThe pulse rates of 158 randomly selected adult males vary from a low of 44 bpm to a high of 120 bpm. Find the minimum sample size required to estimate the mean pulse rate of adult males. Assume that we want 90% confidence that the sample mean is within 2 bpm of the population mean. Complete parts (a) through (c) below. a. Find the sample size using the range rule of thumb to estimate σ. n=245 b. Assume that σ=10.5 bpm, based on the value s=10.5 bpm from the sample of 158 male pulse rates. n= c.. Compare the results from parts (a) and (b). Which result is likely to be better?arrow_forward(Round up to the nearest whole number as needed.)arrow_forward
- Use the Central Limit Theorem to find the mean and standard error of the mean of the sampling distribution. Then sketch a graph of the sampling distribution. The mean price of photo printers on a website is $227 with a standard deviation of $68. Random samples of size 21 are drawn from this population and the mean of each sample is determined.arrow_forwardWe will obtain a sample of quarters and weigh them to determine the mean. How many quarters must we randomly select and weigh if we want to be 99% confident that the sample mean is within 0.025 grams of the true population mean for all quarters? Assume that σ = 0.2 gramsarrow_forwardDetermine the minimum sample size required when you want to be 95% confident that the sample mean is within one unit of the population mean and o=17.2. Assume the population is normally distributedarrow_forward
arrow_back_ios
SEE MORE QUESTIONS
arrow_forward_ios
Recommended textbooks for you
- MATLAB: An Introduction with ApplicationsStatisticsISBN:9781119256830Author:Amos GilatPublisher:John Wiley & Sons Inc
 Probability and Statistics for Engineering and th...StatisticsISBN:9781305251809Author:Jay L. DevorePublisher:Cengage Learning
 Statistics for The Behavioral Sciences (MindTap C...StatisticsISBN:9781305504912Author:Frederick J Gravetter, Larry B. WallnauPublisher:Cengage Learning
  Elementary Statistics: Picturing the World (7th E...StatisticsISBN:9780134683416Author:Ron Larson, Betsy FarberPublisher:PEARSON
 The Basic Practice of StatisticsStatisticsISBN:9781319042578Author:David S. Moore, William I. Notz, Michael A. FlignerPublisher:W. H. Freeman
 Introduction to the Practice of StatisticsStatisticsISBN:9781319013387Author:David S. Moore, George P. McCabe, Bruce A. CraigPublisher:W. H. Freeman
MATLAB: An Introduction with Applications
Statistics
ISBN:9781119256830
Author:Amos Gilat
Publisher:John Wiley & Sons Inc
Probability and Statistics for Engineering and th...
Statistics
ISBN:9781305251809
Author:Jay L. Devore
Publisher:Cengage Learning
Statistics for The Behavioral Sciences (MindTap C...
Statistics
ISBN:9781305504912
Author:Frederick J Gravetter, Larry B. Wallnau
Publisher:Cengage Learning
Elementary Statistics: Picturing the World (7th E...
Statistics
ISBN:9780134683416
Author:Ron Larson, Betsy Farber
Publisher:PEARSON
The Basic Practice of Statistics
Statistics
ISBN:9781319042578
Author:David S. Moore, William I. Notz, Michael A. Fligner
Publisher:W. H. Freeman
Introduction to the Practice of Statistics
Statistics
ISBN:9781319013387
Author:David S. Moore, George P. McCabe, Bruce A. Craig
Publisher:W. H. Freeman