
MATLAB: An Introduction with Applications
6th Edition
ISBN: 9781119256830
Author: Amos Gilat
Publisher: John Wiley & Sons Inc
expand_more
expand_more
format_list_bulleted
Related questions
Question
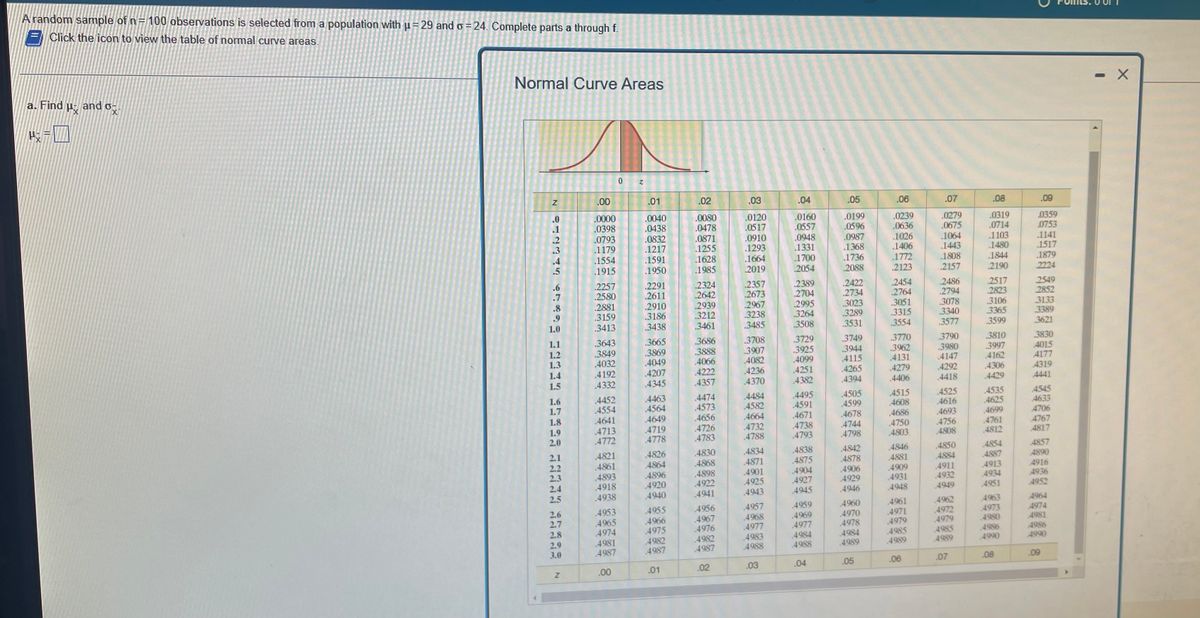

Transcribed Image Text:A random sample of n= 100 observations is selected from a population with p= 29 and o=24. Complete parts a through f.
Click the icon to view the table of nomal curve areas.
Normal Curve Areas
Find
and o-
a.
.00
.01
.02
.03
.04
.05
.06
.07
.08
.09
.0
.1
.0000
.0398
.0793
.0040
.0438
.0080
0478
.0871
.1255
1628
.1985
.0120
0517
.0910
.1293
1664
2019
.0160
.0557
.0948
1331
1700
2054
.0199
.0596
.0987
.1368
1736
2088
.0239
.0636
1026
1406
.1772
2123
.0279
0675
.0319
.0714
.1103
.1480
0359
0753
.0832
.1217
.1064
1443
.1141
1517
1879
2224
.3
.1179
.1554
1915
.1591
1808
1844
2190
.5
.1950
.2157
2257
.2580
.2881
.3159
.3413
.2291
2611
.2910
.3186
.3438
.2324
2642
2939
3212
3461
2357
2673
2967
3238
2389
2704
2995
3264
.3508
.2422
2734
.3023
3289
3531
2454
2764
3051
3315
.3554
2486
2794
3078
3340
3577
2517
2823
3106
3365
.3599
2549
2852
3133
3389
3621
.9
1.0
.3485
1.1
.3643
.3849
.4032
.4192
.4332
3686
3888
4066
.4222
.4357
.3665
.3708
3907
4082
.4236
4370
.3729
.3925
.4099
4251
4382
3749
3944
4115
.4265
.4394
3770
3962
4131
.4279
.4406
3790
3980
.4147
4292
3810
3830
4015
4177
4319
1.2
1.3
.3869
.4049
3997
.4162
.4306
1.4
4207
1.5
.4345
.4418
4429
4441
.4452
.4554
.4641
.4713
.4772
4474
.4573
4656
.4726
.4783
4495
4591
.4671
4738
4793
.4505
4599
1.6
1.7
1.8
1.9
2.0
.4463
.4564
.4484
4582
4515
4608
.4686
4525
4616
4693
4756
4808
.4535
4625
4545
4633
4706
4767
4817
4649
4664
4678
.4699
4719
.4778
4732
.4788
4744
.4798
.4750
.4803
4761
4812
4857
4890
4916
4936
4952
.4838
4875
.4834
4871
4901
4925
4943
4854
4887
4913
.4934
4951
4826
.4830
4842
4846
4850
4821
4861
2.1
2.2
2.3
2.4
2.5
.4878
4906
4929
4884
4911
.4932
4949
4881
.4864
4896
.4920
.4868
.4893
4918
.4938
.4898
4922
4941
4904
.4927
4909
.4931
4948
.4940
.4945
.4946
4962
4972
.4979
4963
4973
4980
4986
4990
4964
.4959
.4969
4977
4961
.4971
4979
4985
4960
4957
4968
4977
4983
4988
4956
.4953
4965
4974
4981
4955
2.6
2.7
4974
4981
4986
A990
4970
4978
.4966
4975
4982
.4987
.4967
.4976
4982
4987
2.8
2.9
3.0
4984
4988
4984
4989
4985
4989
.4989
4987
.04
.05
.06
.07
08
.09
.00
.01
.02
.03
Expert Solution
This question has been solved!
Explore an expertly crafted, step-by-step solution for a thorough understanding of key concepts.

This is a popular solution

Trending nowThis is a popular solution!

Step by stepSolved in 2 steps with 2 images

Knowledge Booster

Similar questions
- Heights of adult males are normally distributed. If a large sample of heights of adult males is randomly selected and the heights are illustrated in a histogram, what is the shape of that histogram? Choose the correct answer below. O Bell-shaped Longer tail to the right Longer tail to the left Uniform O 0 o oarrow_forwardHeights of adult males are normally distributed. If a large sample of heights of adult males is randomly selected and the heights are illustrated in a histogram, what is the shape of that histogram? Choose the correct answer below. Uniform O Longer tail to the left O Longer tail to the right O Bell-shaped Carrow_forwardWhich of the following is shown on the scatter plot below? 10 8 6. 4 2 X. 2 4 6 8 10 Choose cluster negative association outlierarrow_forward
- Use a calculator or computer software to generate a normal quantile plot for the data in the accompanying table. Then determine whether the data come from a normally distributed population. Click the icon to view the data set. Generate a normal quantile plot for the data. Choose the correct graph below. OA. 3.00 2.00- 1.00- 0.00- -1.00- -2.00- -3.00- 0 100 200 300 400 500 X Value Data table Space Flight Durations (hours) 0 350 100 400 300 200 50 150 200 OB. 3.00- 2.00- Print 1.00- 0.00- -1.00- -2.00- -3.00+ 0 BEELD 100 200 300 400 500 X Value 300 300 200 100 450 200 50 0 0 400 100 450 G Determine whether the data come from a normally distributed population. Choose the correct answer below. OA. The distribution is not normal. The points are not reasonably close to a straight line. OB. The distribution is normal. The points show a systematic pattern that is not a straight-line pattern. OC. The distribution is normal. The points are not reasonably close to a straight line and do not show…arrow_forwardPlease answer the question on the attachment.arrow_forwardAssume that a randomly selected subject is given a bone density test. Those test scores are normally distributed with a mean of 0 and a standard deviation of 1. Draw a graph and find the bone density test scores that can be used as cutoff values separating the lowest 10% and highest 10%, indicating levels that are too low or too high, respectively. Sketch the region containing the lowest 10% and highest 10%. Choose the correct graph below. OA. -Za Za Q The bone density scores are ☐ OB. -Za Za (Use a comma to separate answers as needed. Round to two decimal places as needed.) ○ C. Q Za -Za D. Q a G Za -Zaarrow_forward
- Find the median, quartiles, minimum, maximum, range, and IQR of the following scores out of 100 on an examarrow_forwardWhich of the following is NOT an appropriate display for the variable of Grade Point Average? Group of answer choices Dot Plot Scatterplot Boxplot Stem and Leaf Plot Histogramarrow_forwardMar 23, 6:04:40 PM The box-and-whisker plot below represents some data set. What percentage of the data values are greater than 40? Answer: 60 25 50 75 Submit Answer 100 attempt 2 out of 2arrow_forward
- Draw a box plot for the data set with the statistics in the picturearrow_forwardPlease no written by hand solutionsarrow_forwardResearchers wondered whether the size of a person's brain was related to the individual's mental capacity. They selected a sample of 5 females and 5 males and measured their MRI image pixel counts and IQ scores. Females Males MRI IQ MRI IG The data is reported to the right. Complete parts (a) through (d) below 139 858,472 140 955,003 935,494 924,059 1.079.550 1,001.121 Click the icon to view the critical values table. 991,305 138 141 857,782 833,868 790,619 133 135 132 141 135 140 AMRI 1,080,000- AIO 145 AIO 145- AMRI 1,080,000 780,000 130 130 780,000 130 780,000 780,000 130 1,080,000 145 1,080,000 MRI 145 MRI (b) Compute the linear correlation coefficient between MRI count and IQ. Are MRI count and IQ linearly related? Select the correct choice below and, if necessary, fill in the answer box to complete your choice. (Round to three decimal places as needed.) A. Yes, MRI count and IQ are linearly related since the linear correlation coefficient is O B. No. MRI count and IQ are not…arrow_forward
arrow_back_ios
SEE MORE QUESTIONS
arrow_forward_ios
Recommended textbooks for you
- MATLAB: An Introduction with ApplicationsStatisticsISBN:9781119256830Author:Amos GilatPublisher:John Wiley & Sons Inc
 Probability and Statistics for Engineering and th...StatisticsISBN:9781305251809Author:Jay L. DevorePublisher:Cengage Learning
 Statistics for The Behavioral Sciences (MindTap C...StatisticsISBN:9781305504912Author:Frederick J Gravetter, Larry B. WallnauPublisher:Cengage Learning
  Elementary Statistics: Picturing the World (7th E...StatisticsISBN:9780134683416Author:Ron Larson, Betsy FarberPublisher:PEARSON
 The Basic Practice of StatisticsStatisticsISBN:9781319042578Author:David S. Moore, William I. Notz, Michael A. FlignerPublisher:W. H. Freeman
 Introduction to the Practice of StatisticsStatisticsISBN:9781319013387Author:David S. Moore, George P. McCabe, Bruce A. CraigPublisher:W. H. Freeman
MATLAB: An Introduction with Applications
Statistics
ISBN:9781119256830
Author:Amos Gilat
Publisher:John Wiley & Sons Inc
Probability and Statistics for Engineering and th...
Statistics
ISBN:9781305251809
Author:Jay L. Devore
Publisher:Cengage Learning
Statistics for The Behavioral Sciences (MindTap C...
Statistics
ISBN:9781305504912
Author:Frederick J Gravetter, Larry B. Wallnau
Publisher:Cengage Learning
Elementary Statistics: Picturing the World (7th E...
Statistics
ISBN:9780134683416
Author:Ron Larson, Betsy Farber
Publisher:PEARSON
The Basic Practice of Statistics
Statistics
ISBN:9781319042578
Author:David S. Moore, William I. Notz, Michael A. Fligner
Publisher:W. H. Freeman
Introduction to the Practice of Statistics
Statistics
ISBN:9781319013387
Author:David S. Moore, George P. McCabe, Bruce A. Craig
Publisher:W. H. Freeman