
MATLAB: An Introduction with Applications
6th Edition
ISBN: 9781119256830
Author: Amos Gilat
Publisher: John Wiley & Sons Inc
expand_more
expand_more
format_list_bulleted
Related questions
Question
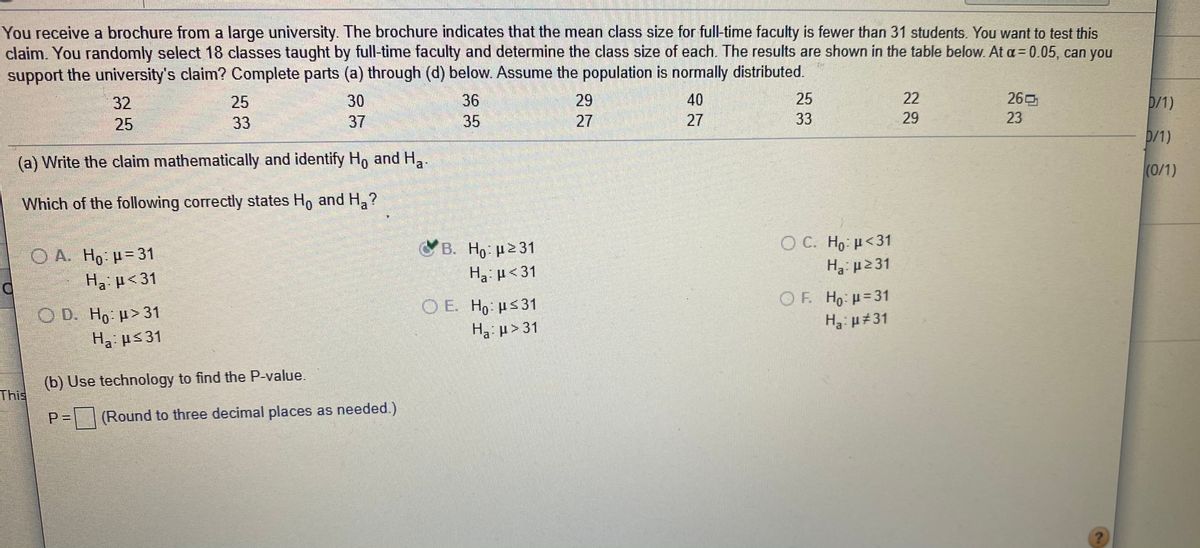

Transcribed Image Text:You receive a brochure from a large university. The brochure indicates that the mean class size for full-time faculty is fewer than 31 students. You want to test this
claim. You randomly select 18 classes taught by full-time faculty and determine the class size of each. The results are shown in the table below. At a = 0.05, can you
support the university's claim? Complete parts (a) through (d) below. Assume the population is normally distributed.
32
25
30
36
29
40
25
22
260
D/1)
25
33
37
35
27
27
33
29
23
D/1)
(a) Write the claim mathematically and identify Ho and H,.
(0/1)
Which of the following correctly states H, and H,?
O C. Ho: H<31
B. Ho: p231
Ha p<31
OA Ho p-31
Ha p<31
|OE.
O E H, ps31
OF. Ho: H=31
O D. Ho H> 31
Ha #31
Ha p> 31
H us31
(b) Use technology to find the P-value.
This,
P%3D
(Round to three decimal places as needed.)
Expert Solution
This question has been solved!
Explore an expertly crafted, step-by-step solution for a thorough understanding of key concepts.

This is a popular solution

Trending nowThis is a popular solution!

Step by stepSolved in 3 steps with 1 images

Knowledge Booster


Learn more about
Need a deep-dive on the concept behind this application? Look no further. Learn more about this topic, statistics and related others by exploring similar questions and additional content below.Similar questions
- Heights of adult males are normally distributed. If a large sample of heights of adult males is randomly selected and the heights are illustrated in a histogram, what is the shape of that histogram? Choose the correct answer below. O Bell-shaped Longer tail to the right Longer tail to the left Uniform O 0 o oarrow_forwardRefer to the figure at the right. At a = 0.10, can you reject the claim that the proportion of 18 to 24-year-olds living in their parents' homes in 2000 was the same for men and women? Assume the survey included a random sample of 270 men and 278 women. Percentage of 18- to 24-year olds living in parents' homes 70,60.4% 54.6% 50.3% 45% 2000 2012 I Men IWomen Identify the null and alternative hypotheses. Choose the correct answer below. O B. Ho: P1 + P2 A. Ho: P1= P2 Hg: P1 P2 H: P1 =P2 OD. Ho: P,> P2 OC. Ho: P1 P2 Hg: P, SP2 Find the critical value(s). The critical value(s) is(are) +1.65. (Round to two decimal places as needed. Use a comma to separate answers as needed.) Find the standardized test statistic. z= 3.61 (Round to two decimal places as needed.) Can you reject the claim that the proportion of 18 to 24-year-olds living in their parents' homes was the same for men and women in 2000? . at the 10% significance level, there is v evidence to v the claim.arrow_forwardWhat is the name of the test used?arrow_forward
- Heights of adult males are normally distributed. If a large sample of heights of adult males is randomly selected and the heights are illustrated in a histogram, what is the shape of that histogram? Choose the correct answer below. Uniform O Longer tail to the left O Longer tail to the right O Bell-shaped Carrow_forwardThe school cafeteria collects data on students’ juice box selections. What type of data are these? 1.categorical, nominal data 2.numerical, discrete data 3.categorical, ordinal data 4.numerical, continuous dataarrow_forwardArm circumferences of 122 outpatients at a clinic in Santa Cruz are measured in centimeters. The resulting data are ... O Numerical and continuous. O Numerical and discrete. O Categorical and ordinal. O Categorical and nominal.arrow_forward
- DO THIS TYPEWRITTEN FOR UPVOTEarrow_forwardThe following set of data represents the number of orders filled by a national-chain restaurant during a two week period. Construct a five number summary for the the data. 66, 75, 68, 89, 86, 73, 67, 75, 75, 82, 85, 74, 67, 61 (Round to the nearest hundredth, if needed). Min _________________ Lower Quartile _________________ Median __________________ Upper Quartile _________________ Maximum __________________ What is the range and the interquartile range (IQR)? Range __________________ Interquartile Range (IQR) ___________________arrow_forwardTrying to determine the number of students to accept is a tricky task for universities. The Admissions staff at a small private college wants to use data from the past few years to predict the number of students enrolling in the university from those who are accepted by the university. The data are provided in the following table. R F eTextbook and Media Save for Late O % 5 T O >> G H (9) 2 Number Accepted Number Enrolled Find the correlation between the number of students accepted and enrolled. Use two decimal places in your answer. & 2,440 2,800 2,720 2,360 2,660 2,620 8 6 611 K 708 637 584 614 625 ( 9 L Attempts: 0 of 1 used ) 0 P Submit Answer 56°F Cl Backspaarrow_forward
- Derby collects samples of insects in the forest and in a marsh to count the number of insects in each sample and then releases the insects. The number of insects in each sample from the two locations is provided below. Forest 1515 1313 1414 99 1616 1111 1515 1414 1515 1414 Marsh 1717 1414 1515 1717 1616 1818 1717 1919 1313 1616 What is the median and the interquartile range for each of the two locations? Round to one decimal place. The median number of insects in the forest samples is , and the interquartile range is . The median number of insects in the marsh samples is , and the interquartile range is .arrow_forwardGame Attendance An athletic director suggests the median number for the paid attendance at 18 local football games is 3000. The data for a sample are shown. At a 0.05, is there enough evidence to reject the claim? If you were printing the programs for the games, would you use this figure as a guide? 4231 5605 2556 5228 5586 3675 3867 3610 4679 5676 5779 4745 2907 4925 4785 4551 3112 3688 Send dats to Excel Part: 0/6 Part 1 of 6 (a) State the hypotheses and identify the claim with the correct hypotheses Ho (Choose one) (Choose one) This hypothesis test is a (Choose one) test. 00000-0 D-Darrow_forwardTornadoes The following data represent the width (inyards) and length (in miles) of tornadoes.Width (yards), w Length (miles), L200 2.5350 4.8180 2.0300 2.5500 5.8400 4.5500 8.0800 8.0100 3.450 0.5700 9.0600 5.7Source: NOAA(a) Draw a scatter diagram of the data, treating width as theindependent variable.(b) What type of relation appears to exist between the widthand the length of tornadoes?(c) Select two points and find a linear model that containsthe points.(d) Graph the line on the scatter diagram drawn in part (b).(e) Use the linear model to predict the length of a tornadothat has a width of 450 yards.(f) Interpret the slope of the line found in part (c).arrow_forward
arrow_back_ios
SEE MORE QUESTIONS
arrow_forward_ios
Recommended textbooks for you
- MATLAB: An Introduction with ApplicationsStatisticsISBN:9781119256830Author:Amos GilatPublisher:John Wiley & Sons Inc
 Probability and Statistics for Engineering and th...StatisticsISBN:9781305251809Author:Jay L. DevorePublisher:Cengage Learning
 Statistics for The Behavioral Sciences (MindTap C...StatisticsISBN:9781305504912Author:Frederick J Gravetter, Larry B. WallnauPublisher:Cengage Learning
  Elementary Statistics: Picturing the World (7th E...StatisticsISBN:9780134683416Author:Ron Larson, Betsy FarberPublisher:PEARSON
 The Basic Practice of StatisticsStatisticsISBN:9781319042578Author:David S. Moore, William I. Notz, Michael A. FlignerPublisher:W. H. Freeman
 Introduction to the Practice of StatisticsStatisticsISBN:9781319013387Author:David S. Moore, George P. McCabe, Bruce A. CraigPublisher:W. H. Freeman
MATLAB: An Introduction with Applications
Statistics
ISBN:9781119256830
Author:Amos Gilat
Publisher:John Wiley & Sons Inc
Probability and Statistics for Engineering and th...
Statistics
ISBN:9781305251809
Author:Jay L. Devore
Publisher:Cengage Learning
Statistics for The Behavioral Sciences (MindTap C...
Statistics
ISBN:9781305504912
Author:Frederick J Gravetter, Larry B. Wallnau
Publisher:Cengage Learning
Elementary Statistics: Picturing the World (7th E...
Statistics
ISBN:9780134683416
Author:Ron Larson, Betsy Farber
Publisher:PEARSON
The Basic Practice of Statistics
Statistics
ISBN:9781319042578
Author:David S. Moore, William I. Notz, Michael A. Fligner
Publisher:W. H. Freeman
Introduction to the Practice of Statistics
Statistics
ISBN:9781319013387
Author:David S. Moore, George P. McCabe, Bruce A. Craig
Publisher:W. H. Freeman