MATLAB: An Introduction with Applications
6th Edition
ISBN: 9781119256830
Author: Amos Gilat
Publisher: John Wiley & Sons Inc
expand_more
expand_more
format_list_bulleted
Question


Transcribed Image Text:The National Safety Board wants to determine the effect of seat belt use on saving lives. One study showed data on children under
the age of 5 who were involved in car accidents in which at least one fatality occurred. Below is the table:
X1
Survivors (0)
Fatalities (1)
Total
No belt (0)
Adult belt (1)
Child seat (2)
1129
509
1638
X2
432
73
505
733
139
872
Total
2294
721
3015
Answer in 2 decimal places.
a) Determine the probability that a child will be in a child seat.
b) Determine the probability that X1 = 0 given X2 = 0
c) What is the probability of X1 = 1 given X2 = 0?
Expert Solution
arrow_forward
Step 1
Since we only answer up to 3 sub-parts, we’ll answer the first 3. Please resubmit the question and specify the other subparts (up to 3) you’d like answered.
It is given that to determine the effect of seat belt use on saving lives. The given data is based on children under the age of 5 who were involved in car accidents in which at least one fatality occurred.
The given dataset is:
|
X2 |
X1 |
|||
|
|
Survivors (0) |
Fatalities (1) |
Total |
|
|
No belt (0) |
1129 |
509 |
1638 |
|
|
Adult belt (1) |
432 |
73 |
505 |
|
|
Child belt (2) |
733 |
139 |
872 |
|
|
Total |
2294 |
721 |
3015 |
|
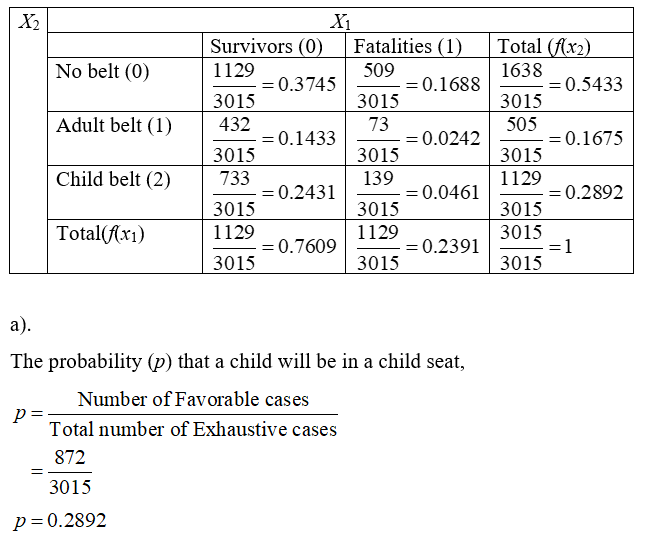
Since, the given data for the joint distribution function.
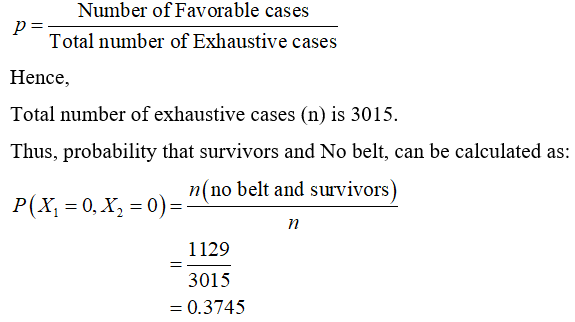
The probability p for each column can be calculated as:

arrow_forward
Step 2
Similarly, for all the columns,

Step by stepSolved in 3 steps with 3 images

Knowledge Booster
Learn more about
Need a deep-dive on the concept behind this application? Look no further. Learn more about this topic, statistics and related others by exploring similar questions and additional content below.Similar questions
- Your statistics instructor often ponders the relationship between commute time and job satisfaction while driving back and forth to campus. Your instructor hypothesizes that people with a shorter commute time will have higher degrees of job satisfaction. Randomly sampling 600 Valley commuters, the instructor finds the following data listed in frequencies: Table 2: Commuters by Length of Commute and Job Satisfaction Job Satisfaction Number Who Commute 20 Minutes or Less Number Who Commute 21 to 40 Minutes Number Who Commute 41 Minutes or More Total Number for Each Level of Job Satisfaction Dissatisfied 10 60 140 210 Neutral 45 59 51 155 Satisfied 145 60 30 235 Total Number for Each Commute Time Range 200 179 221 1. Change frequencies to column percentages.arrow_forwardThe following table shows some data from a study on substance use among 10th graders in the United States and Europe. Smoked Cigarettes Cigarette-Free Totals U.S. 14,000 Europe 96,000 Total 71,210 110,000arrow_forwardThe National Hurricane Center provides data that list the number of large (category 3, 4, or 5) hurricanes that have struck the United States, by decade, from 1851-2020. Is there sufficient evidence that the number of large hurricanes have remained constant (per decade)? What are the degrees of freedom? Decade Count Decade Count 1851-1860 6 1941-1950 10 1861-1870 1 1951-1960 8 1871-1880 7 1961-1970 6 1881-1890 5 1971-1980 4 1891-1900 8 1981-1990 5 1901-1910 4 1991-2000 5 1911-1920 7 2001-2010 8 1921-1930 5 2011-2020 10 1931-1940 8 Chi-squared test for given probabilitiesdata: stormsX-squared = 13.589, df = 16, p-value = 0.6293 A. 107 B. 17 C. 13.589 D. 16arrow_forward
- Given the following list of data, what is the five-number summary?110, 111, 140, 190, 199, 204, 238, 270, 279, 310, 320 Select the correct answer below: Min Q1 Median Q3 Max 100 140 204 279 350 Min Q1 Median Q3 Max 110 111 204 279 300 Min Q1 Median Q3 Max 110 140 204 279 320arrow_forwardQuestion 3. A researcher wished to gauge public opinion on gun control. He randomly selected 1000 people from the list of registered voters and asked them the following question: Do you believe that gun control laws which restricts the ability of Ghanaians to protect their families should be eliminated? i. Identify the two instances of inappropriate use of statistics in the approach used by the researcher. ii. Suggest a remedy for improving the approach used by the researcher.arrow_forward
arrow_back_ios
arrow_forward_ios
Recommended textbooks for you
 MATLAB: An Introduction with ApplicationsStatisticsISBN:9781119256830Author:Amos GilatPublisher:John Wiley & Sons Inc
 Probability and Statistics for Engineering and th...StatisticsISBN:9781305251809Author:Jay L. DevorePublisher:Cengage Learning
 Statistics for The Behavioral Sciences (MindTap C...StatisticsISBN:9781305504912Author:Frederick J Gravetter, Larry B. WallnauPublisher:Cengage Learning
 Elementary Statistics: Picturing the World (7th E...StatisticsISBN:9780134683416Author:Ron Larson, Betsy FarberPublisher:PEARSON
 The Basic Practice of StatisticsStatisticsISBN:9781319042578Author:David S. Moore, William I. Notz, Michael A. FlignerPublisher:W. H. Freeman
 Introduction to the Practice of StatisticsStatisticsISBN:9781319013387Author:David S. Moore, George P. McCabe, Bruce A. CraigPublisher:W. H. Freeman

MATLAB: An Introduction with Applications
Statistics
ISBN:9781119256830
Author:Amos Gilat
Publisher:John Wiley & Sons Inc

Probability and Statistics for Engineering and th...
Statistics
ISBN:9781305251809
Author:Jay L. Devore
Publisher:Cengage Learning

Statistics for The Behavioral Sciences (MindTap C...
Statistics
ISBN:9781305504912
Author:Frederick J Gravetter, Larry B. Wallnau
Publisher:Cengage Learning

Elementary Statistics: Picturing the World (7th E...
Statistics
ISBN:9780134683416
Author:Ron Larson, Betsy Farber
Publisher:PEARSON

The Basic Practice of Statistics
Statistics
ISBN:9781319042578
Author:David S. Moore, William I. Notz, Michael A. Fligner
Publisher:W. H. Freeman

Introduction to the Practice of Statistics
Statistics
ISBN:9781319013387
Author:David S. Moore, George P. McCabe, Bruce A. Craig
Publisher:W. H. Freeman