MATLAB: An Introduction with Applications
6th Edition
ISBN: 9781119256830
Author: Amos Gilat
Publisher: John Wiley & Sons Inc
expand_more
expand_more
format_list_bulleted
Question

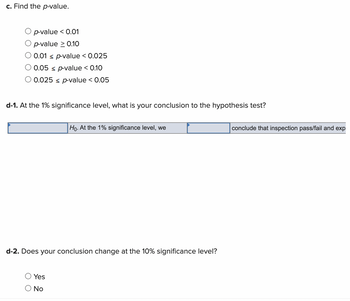
Transcribed Image Text:c. Find the p-value.
p-value < 0.01
p-value > 0.10
O 0.01 < p-value < 0.025
0.05 ≤ p-value < 0.10
O 0.025 ≤ p-value < 0.05
d-1. At the 1% significance level, what is your conclusion to the hypothesis test?
d-2. Does your conclusion change at the 10% significance level?
Yes
Ho. At the 1% significance level, we
O No
conclude that inspection pass/fail and exp

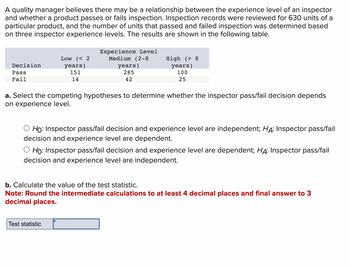
Transcribed Image Text:A quality manager believes there may be a relationship between the experience level of an inspector
and whether a product passes or fails inspection. Inspection records were reviewed for 630 units of a
particular product, and the number of units that passed and failed inspection was determined based
on three inspector experience levels. The results are shown in the following table.
Decision
Pass
Fail
Low (< 2
years)
151
14
Experience Level
Medium (2-8
years)
285
42
High (> 8
years)
100
25
a. Select the competing hypotheses to determine whether the inspector pass/fail decision depends
on experience level.
Test statistic
Ho: Inspector pass/fail decision and experience level are independent; HA: Inspector pass/fail
decision and experience level are dependent.
Ho: Inspector pass/fail decision and experience level are dependent; HA: Inspector pass/fail
decision and experience level are independent.
b. Calculate the value of the test statistic.
Note: Round the intermediate calculations to at least 4 decimal places and final answer to 3
decimal places.
Expert Solution
This question has been solved!
Explore an expertly crafted, step-by-step solution for a thorough understanding of key concepts.
This is a popular solution
Trending nowThis is a popular solution!
Step by stepSolved in 7 steps with 18 images

Knowledge Booster
Similar questions
- Consider the following data. 14,6,−11,−6,5,1014,6,−11,−6,5,10 Copy Data Step 1 of 3: Determine the mean of the given data.arrow_forwardA sales manager collected the following data on annual sales and years of experience. Annual Sales ($1000s) 80 Salesperson Years of Experience 1 1 4 102 3 6 103 4 10 119 5 13 136arrow_forwardDetermine the interquartile range of the following data: 155, 134, 153, 119, 89.arrow_forward
- Name 3) The Tire Rack, an online distributor of tires and wheels, conducts extensive testing to provide customers with products that are right for their vehicle, driving style, and driving conditions. In addition, the Tire Rack maintains an independent customer survey to help drivers help each other by sharing their long-term tire experiences (The Tire Rack website, August 1, 2016). The following data shows survey results (one to 10 scale with 10 being the highest rating) for 18 high performance all season tires. The variable tread wear rates quickness of wear based on drivers expectations, the variability dry traction rates the grip of a tire on a dry road, the variable steering rates the tires steering responsiveness, and the variable buy again rates the driver's desire to purchase the same tire again. Tire Sumitomo HTR A/S PO2 Goodyear Eagle Sport All-Season Michelin Pilot Sport A/S 3 Kumho Ecsta PA 31 Firestone Firehawk Wide Oval AS BFGoodrich g-Force Super Sport A/S Yokohama AVID…arrow_forwardTrying to determine the number of students to accept is a tricky task for universities. The Admissions staff at a small private college wants to use data from the past few years to predict the number of students enrolling in the university from those who are accepted by the university. The data are provided in the following table. R F eTextbook and Media Save for Late O % 5 T O >> G H (9) 2 Number Accepted Number Enrolled Find the correlation between the number of students accepted and enrolled. Use two decimal places in your answer. & 2,440 2,800 2,720 2,360 2,660 2,620 8 6 611 K 708 637 584 614 625 ( 9 L Attempts: 0 of 1 used ) 0 P Submit Answer 56°F Cl Backspaarrow_forwardA sales manager collected the following data on annual sales and years of experience. Annual Sales ($1000s) 80 Salesperson Years of Experience 1 1 4 102 3 6 103 4 10 119 5 13 136arrow_forward
- Consider the following data set: i X 1 -4 23410 5 -2 0 2 4 Y₁ -10.672 -6.428 -2.242 1.946 7.596arrow_forwardJohnson Wholesale Company manufactures a variety of products. The prices and quantities produced for April 2010 and April 2019 are: 2010 2019 2010 Quantity 2019 Quantity Product Price Price Produced Produced Small motor (each) $ 23.92 $ 28.29 1,413 4,234 Scrubbing compound (gallon) 2.32 3.70 86,827 62,984 Nails (pound) 0.19 0.86 9,332 22,336 Click here for the Excel Data FileUsing April 2010 as the base period, find the value index of goods produced for April 2019. (Round your answer to 2 decimal places.)arrow_forwardGiven the following data: 7, 11, 19, 8, 9, 20, 17, and 16. Identify the range 7. 8.5 O 13.5 O 9.5 13arrow_forward
- Review the following admission and discharge rates from a local hospital within a 24-hour period. Admissions 896 on Jan. 1, 2017 649 on Jan. 2, 2017 1,503 on Jan 3, 2017 Discharges 764 on Jan. 1, 2017 543 on Jan. 2, 2017 672 on Jan. 3, 2017 Answer the prompts using the information provided. Identify the information above that represents a data set. How do you know this is a data set? Identify the information above that represents a database. How do you know this is a database? What was the discharge rate for Jan. 2, 2017? What was the admission rate for Jan. 3, 2017? Which day had the highest percentage of patients discharged within the 24-hour period? What can you infer from this data? What important information is missing from this data?arrow_forwardThe personnel files of all eight employees at the Pawnee location of Acme Carpet Cleaners Inc. revealed that during the last 6-month period they lost the following number of days due to illness: 5 5 4 4 1 2 All eight employees during the same period at the Chickpee location of Acme Carpets revealed they lost the following number of days due to illness: Range Mean 2 1 0 10 2 2 3 0 0 6 Click here for the Excel Data File Required: a. Calculate the range and mean for the Pawnee location and the Chickpee location. (Round the "Mean" to 2 decimal places.) Pawnee location O Chickpee location O Pawnee location Chickpee location b-1. Based on the data which location has fewer lost days?arrow_forwardplease answer parts a,b,c,d. Thanksarrow_forward
arrow_back_ios
arrow_forward_ios
Recommended textbooks for you
 MATLAB: An Introduction with ApplicationsStatisticsISBN:9781119256830Author:Amos GilatPublisher:John Wiley & Sons Inc
 Probability and Statistics for Engineering and th...StatisticsISBN:9781305251809Author:Jay L. DevorePublisher:Cengage Learning
 Statistics for The Behavioral Sciences (MindTap C...StatisticsISBN:9781305504912Author:Frederick J Gravetter, Larry B. WallnauPublisher:Cengage Learning
 Elementary Statistics: Picturing the World (7th E...StatisticsISBN:9780134683416Author:Ron Larson, Betsy FarberPublisher:PEARSON
 The Basic Practice of StatisticsStatisticsISBN:9781319042578Author:David S. Moore, William I. Notz, Michael A. FlignerPublisher:W. H. Freeman
 Introduction to the Practice of StatisticsStatisticsISBN:9781319013387Author:David S. Moore, George P. McCabe, Bruce A. CraigPublisher:W. H. Freeman

MATLAB: An Introduction with Applications
Statistics
ISBN:9781119256830
Author:Amos Gilat
Publisher:John Wiley & Sons Inc

Probability and Statistics for Engineering and th...
Statistics
ISBN:9781305251809
Author:Jay L. Devore
Publisher:Cengage Learning

Statistics for The Behavioral Sciences (MindTap C...
Statistics
ISBN:9781305504912
Author:Frederick J Gravetter, Larry B. Wallnau
Publisher:Cengage Learning

Elementary Statistics: Picturing the World (7th E...
Statistics
ISBN:9780134683416
Author:Ron Larson, Betsy Farber
Publisher:PEARSON

The Basic Practice of Statistics
Statistics
ISBN:9781319042578
Author:David S. Moore, William I. Notz, Michael A. Fligner
Publisher:W. H. Freeman

Introduction to the Practice of Statistics
Statistics
ISBN:9781319013387
Author:David S. Moore, George P. McCabe, Bruce A. Craig
Publisher:W. H. Freeman