MATLAB: An Introduction with Applications
6th Edition
ISBN: 9781119256830
Author: Amos Gilat
Publisher: John Wiley & Sons Inc
expand_more
expand_more
format_list_bulleted
Question

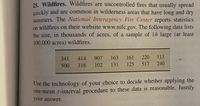
Transcribed Image Text:25. Wildfires. Wildfires are uncontrolled fires that usually spread
quickly and are common in wilderness areas that have long and dry
summers. The National Interagency Fire Center reports statistics
on wildfires on their website www.nifc.gov. The following data lists
the size, in thousands of acres, of a sample of 14 large (at least
100,000 acres) wildfires.
341
414
907 163
161
220
113
500
316
102
131
125
517
240
Use the technology of your choice to decide whether applying the
one-mean t-interval procedure to these data is reasonable. Justify
your answer.
Expert Solution
This question has been solved!
Explore an expertly crafted, step-by-step solution for a thorough understanding of key concepts.
This is a popular solution
Trending nowThis is a popular solution!
Step by stepSolved in 2 steps with 1 images

Knowledge Booster
Similar questions
- The length of fish were measured at 3 different lakes. Is there evidence to suggest that the average length is not the same at all 3 locations? Lake 1: 3.5, 4.2, 2.1, 3.2, 1.7 Lake 2: 5.1, 6.2, 5.3,4.1 Lake 3: 5.6, 7.1, 6.4, 7.1, 6.4 What is your conclusion? There is not evidence that the mean length at one of the lakes is different then the others. There is evidence hat the mean length at a least one lake is different then the others.arrow_forwardIf a set of sample measurements has a mean of 100, a normal distribution, a standard deviation of 2, and control limits of 94 and 106, what percentage of the samples are expected to be between 94 and 106? Explain your answer.arrow_forwardIn a 430-page manuscript, there are 270 randomly distributed misprints. Use the Poison approximation. Find the mean number 2 of misprints per page. Round to one decimal place as needed.arrow_forward
- When we make a set of measurements, the width or standard deviation of the sampled parent distribution generally reflects the accuracy of our measurement methods. True or Falsearrow_forwardTo determine if their 1.50 inch steel handles are properly adjusted, Smith & Johnson Industries has decided to use an X-Chart which uses the range to estimate the variability in the sample. Step 1 of 7: What is the Center Line of the control chart? Round your answer to three decimal places. Table Period 1 2 Control Chart AnswerHow Select the Copy Table button to copy all values. To select an entire row or column, either click on the row or column header or use the Shi and arrow keys. To find the average of the selected cells, select the Average Values button. Copy Table 456789 Sample Mean Sample Range obs1 obs2 obs3 obs4 obs5 obs6 1.46 1.50 1.46 1.53 1.55 1.54 1.5067 1.54 1.45 1.49 1.4983 1.53 1.46 1.52 1.45 1.47 3 1.50 1.54 1.47 1.51 1.4900 1.53 1.47 1.50 1.53 1.5067 1.46 1.45 1.49 1.4850 1.51 1.5117 1.49 1.52 1.54 1.50 1.46 1.54 1.53 1.46 1.51 1.52 1.49 1.46 1.50 1.47 1.47 1.53 1.53 1.50 1.47 1.52 1.45 1.51 1.52 1.54 1.54 1.50 1.5050 1.5067 1.55 1.49 1.54 1.5083 1.51 1.54 1.5050 1.49…arrow_forwardDepths (in kilometers) of 7 earthquakes in Calixio, California and Guadalupe Victoria are given below: 11, 17, 10, 16, 10, 13, 11. a) Find the mean depth of earthquakes and report it with correct symbol. b) Find the median depth of earthquakes. c) What is the shape of the distribution of earthquakes? Give a reason for your answer. Edit View Insert Format Tools Table 12pt v Paragraph v | B IU A v DELL F10 F11 F4 F5 F6 F7 F8 F9arrow_forward
- 9. If we take samples of size 110 from a population with proportion 0.39, comment on whether the sampling distribution follows a normal distribution. Explain.arrow_forwardwhat is the population of focus? a reasearch is being done to determine canopy spread of a type of MATURE tree in a given location. the location has 40,000 of these and the mature trees are estimated at 10feet tall. the research collected spread from 1000 random mature trees.arrow_forward
arrow_back_ios
arrow_forward_ios
Recommended textbooks for you
 MATLAB: An Introduction with ApplicationsStatisticsISBN:9781119256830Author:Amos GilatPublisher:John Wiley & Sons Inc
 Probability and Statistics for Engineering and th...StatisticsISBN:9781305251809Author:Jay L. DevorePublisher:Cengage Learning
 Statistics for The Behavioral Sciences (MindTap C...StatisticsISBN:9781305504912Author:Frederick J Gravetter, Larry B. WallnauPublisher:Cengage Learning
 Elementary Statistics: Picturing the World (7th E...StatisticsISBN:9780134683416Author:Ron Larson, Betsy FarberPublisher:PEARSON
 The Basic Practice of StatisticsStatisticsISBN:9781319042578Author:David S. Moore, William I. Notz, Michael A. FlignerPublisher:W. H. Freeman
 Introduction to the Practice of StatisticsStatisticsISBN:9781319013387Author:David S. Moore, George P. McCabe, Bruce A. CraigPublisher:W. H. Freeman

MATLAB: An Introduction with Applications
Statistics
ISBN:9781119256830
Author:Amos Gilat
Publisher:John Wiley & Sons Inc

Probability and Statistics for Engineering and th...
Statistics
ISBN:9781305251809
Author:Jay L. Devore
Publisher:Cengage Learning

Statistics for The Behavioral Sciences (MindTap C...
Statistics
ISBN:9781305504912
Author:Frederick J Gravetter, Larry B. Wallnau
Publisher:Cengage Learning

Elementary Statistics: Picturing the World (7th E...
Statistics
ISBN:9780134683416
Author:Ron Larson, Betsy Farber
Publisher:PEARSON

The Basic Practice of Statistics
Statistics
ISBN:9781319042578
Author:David S. Moore, William I. Notz, Michael A. Fligner
Publisher:W. H. Freeman

Introduction to the Practice of Statistics
Statistics
ISBN:9781319013387
Author:David S. Moore, George P. McCabe, Bruce A. Craig
Publisher:W. H. Freeman