
MATLAB: An Introduction with Applications
6th Edition
ISBN: 9781119256830
Author: Amos Gilat
Publisher: John Wiley & Sons Inc
expand_more
expand_more
format_list_bulleted
Related questions
Question
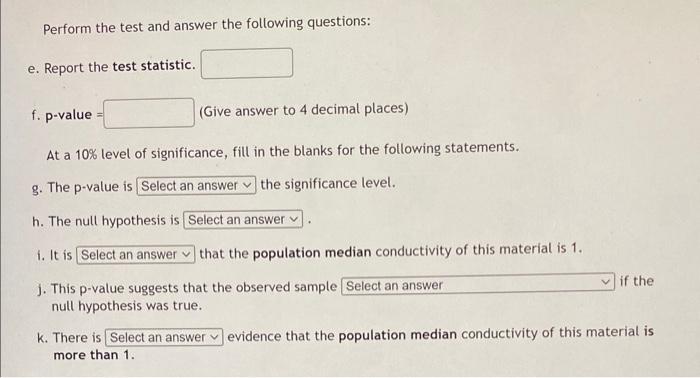

Transcribed Image Text:Perform the test and answer the following questions:
e. Report the test statistic.
f. p-value
(Give answer to 4 decimal places)
At a 10% level of significance, fill in the blanks for the following statements.
g. The p-value is [Select an answer the significance level.
h. The null hypothesis is
Select an answer
that the population median conductivity of this material is 1.
i. It is Select an answer
j. This p-value suggests that the observed sample [Select an answer
null hypothesis was true.
if the
k. There is Select an answer evidence that the population median conductivity of this material is
more than 1.

Transcribed Image Text:The National Institute of Standard and Technology provided exact data on conductivity properties of
materials. Following are conductivity measurements for 11 randomly selected pieces of a particular type of
glass.
Click this button to reveal the data
Conductivtity
1.11
1.07
1.11
1.07
1.12
1.08
0.98
0.98
1.02
0.95
0.95
Download CSV file
Download the .csv file or copy/paste the data into Excel. After downloading .csv file, you may want to
save it as a Excel Workbook.
Based on these data, is there evidence that the median conductivity of this type of glass is greater than 1?
Use a 10% level of significance level.
a. How many samples of data are there in this study?
b. What test you would use for this problem? Select an answer
c. The null hypothesis of this test states that Select an answer
d. What type of test is this?
O One-side
Two-side
Expert Solution
This question has been solved!
Explore an expertly crafted, step-by-step solution for a thorough understanding of key concepts.

This is a popular solution

Trending nowThis is a popular solution!

Step by stepSolved in 3 steps with 2 images

Knowledge Booster

Similar questions
- In West Texas, water is extremely important. The following data represent pH levels in ground water for a random sample of 102 West Texas wells. A pH less than 7 is acidic and a pH above 7 is alkaline. Scanning the data, you can see that water in this region tends to be hard (alkaline). Too high a pH means the water is unusable or needs expensive treatment to make it usable.† These data are also available for download at the Companion Sites for this text. For convenience, the data are presented in increasing order.arrow_forwardPlease let me know the full answerarrow_forwardIn West Texas, water is extremely important. The following data represent pH levels in ground water for a random sample of 102 West Texas wells. A pH less than 7 is acidic and a pH above 7 is alkaline. Scanning the data, you can see that water in this region tends to be hard (alkaline). Too high a pH means the water is unusable or needs expensive treatment to make it usable.† These data are also available for download at the Companion Sites for this text. For convenience, the data are presented in increasing order.arrow_forward
- K Maya Paniagua - L8.5 HW.pdf K Maya Paniagua - L8.5 CW pdf The School District of Palm Beac X sses R i web.kamihq.com/web/viewer.html?state=%7B"ids"%3A%5B"1Y9_ze2BW1NVXI00HyNvRVnRzNRvzyz6C"%5D%2C'action"%3.. SC Bookmarks E Maya Paniagua - C. 100% Student Edu O e A Geometry 202. Maya Paniagua - L8.5 HW.pdf 3. MK = 24, JL = 20, and m/MJL = 50° NK = m/KNL = NL = m/KJL = ML = M2MLK = JM = MZJKM = MZJML = Marrow_forwardWeatherwise is a magazine published by the American Meteorological Society. One issue gives a rating system used to classify Nor'easter storms that frequently hit New England and can cause much damage near the ocean. A severe storm has an average peak wave height of u = 16.4 feet for waves hitting the shore. Suppose that a Nor'easter is in progress at the severe storm class rating. Peak wave heights are usually measured from land (using binoculars) off fixed cement piers. Suppose that a reading of 34 waves showed an average wave height of x = 16.7 feet. Previous studies of severe storms indicate that o = 3.5 feet. Does this information suggest that the storm is (perhaps temporarily) increasing above the severe rating? Use a = 0.01.arrow_forwardHow well does the line describe the data? What is the mileage that you would expect a 4000-pound car to have?arrow_forward
- In West Texas, water is extremely important. The following data represent pH levels in ground water for a random sample of 102 West Texas wells. A pH less than 7 is acidic and a pH above 7 is alkaline. Scanning the data, you can see that water in this region tends to be hard (alkaline). Too high a pH means the water is unusable or needs expensive treatment to make it usable.† These data are also available for download at the Companion Sites for this text. For convenience, the data are presented in increasing order. Make an ogive using five classes. (Graph each point and the closed line segments connecting the points to create your graph.)arrow_forwardI need help with part barrow_forwardSpotify ll ? 9:45 AM 55% Done Photo o T| |A |O * * RJ | | + a C aludan.dasmos comacivtyb.ideristudentcoGdacda2dcannd1178ao45drcmerldsu Appa a artaure Cerrac. Chre Dey . O Er m Cer on I sesve Priuriee + Logn Sesir Epir. a Sel ing cckte- E Sri vkw PtraPw. 6 NLISIE Iat. = Unit IV Entrance Tickets Not> 7of 15 Wat foryour tsachor to alow access to this Soroan Lesson 7 Entrance Ticket It is estimated that the weight of a population of brown bears is approximately nomaly dcistributed with a mean of 600 pounds and a standard deviation of 120 pcunds. Approximately what proportion of the bears in the population weigh less then 720 pcunds? Please prov de mathematical reasoning to support your caim. Subrni చే 14 .3 4 5 6 7 Q E R Y A D F G J K capa lock V B M shift command option fn control option commandarrow_forward
- 3) both photos are the same questionarrow_forwardAccording to an exit poll for an election, 55.1% of the sample size of 819 reported voting for a specific candidate. Is this enough evidence to predict who won? Test that the population proportion who voted for this candidate was 0.50 against the alternative that it differed from 0.50. Complete parts a through d below. OD. The parameter is the number of voters that voted for the candidate. Define the notation for the parameter. OA. p= the number of voters that did not vote for the candidate OB. p= the number of voters that voted for the candidate C. p=population proportion of voters that voted for the candidate D. p=sample proportion of votes for the candidate b. State the hypotheses and check the assumptions for a large-sample test. Choose the correct answer below. O A. Ho: p=0.50; H₂: p0.50 The assumptions for a large-sample test are met. c. Report the test statistic and P-value and interpret the latter. (Round to two decimal places as needed.) ... D F (1) More xarrow_forwardStat... sp File www all pl 5 Edit View Go Tools Window Help V ThePracticeofStatistics6th Edition byStarnesc2.pdf Page 546 of 1,776 y create two te " of carcls (83 w/A bowl and give them and give dy in a bowl dom sinus Number of tosses An unenlightened gambler a. A gambler knows that red and black are equally likely to occur on each spin of a roulette wheel. He observes that 5 consecutive reds have occurred and bets heavily on black at the next spin. Asked why, he explains that "black is due.” Explain to the gambler what is wrong with this reasoning. un ¹. O X b. After hearing you explain why red and black are still equally likely after 5 reds on the roulette wheel, the gambler moves to a card game. He is dealt 5 straight red cards from a standard deck with 26 red cards and 26 black cards. He remembers what you said and assumes that the next card dealt in the same hand is equally likely to be red or black. Explain to the gambler what is wrong with this reasoning. b Due for a hit A very…arrow_forward
arrow_back_ios
SEE MORE QUESTIONS
arrow_forward_ios
Recommended textbooks for you
- MATLAB: An Introduction with ApplicationsStatisticsISBN:9781119256830Author:Amos GilatPublisher:John Wiley & Sons Inc
 Probability and Statistics for Engineering and th...StatisticsISBN:9781305251809Author:Jay L. DevorePublisher:Cengage Learning
 Statistics for The Behavioral Sciences (MindTap C...StatisticsISBN:9781305504912Author:Frederick J Gravetter, Larry B. WallnauPublisher:Cengage Learning
  Elementary Statistics: Picturing the World (7th E...StatisticsISBN:9780134683416Author:Ron Larson, Betsy FarberPublisher:PEARSON
 The Basic Practice of StatisticsStatisticsISBN:9781319042578Author:David S. Moore, William I. Notz, Michael A. FlignerPublisher:W. H. Freeman
 Introduction to the Practice of StatisticsStatisticsISBN:9781319013387Author:David S. Moore, George P. McCabe, Bruce A. CraigPublisher:W. H. Freeman
MATLAB: An Introduction with Applications
Statistics
ISBN:9781119256830
Author:Amos Gilat
Publisher:John Wiley & Sons Inc
Probability and Statistics for Engineering and th...
Statistics
ISBN:9781305251809
Author:Jay L. Devore
Publisher:Cengage Learning
Statistics for The Behavioral Sciences (MindTap C...
Statistics
ISBN:9781305504912
Author:Frederick J Gravetter, Larry B. Wallnau
Publisher:Cengage Learning
Elementary Statistics: Picturing the World (7th E...
Statistics
ISBN:9780134683416
Author:Ron Larson, Betsy Farber
Publisher:PEARSON
The Basic Practice of Statistics
Statistics
ISBN:9781319042578
Author:David S. Moore, William I. Notz, Michael A. Fligner
Publisher:W. H. Freeman
Introduction to the Practice of Statistics
Statistics
ISBN:9781319013387
Author:David S. Moore, George P. McCabe, Bruce A. Craig
Publisher:W. H. Freeman