
MATLAB: An Introduction with Applications
6th Edition
ISBN: 9781119256830
Author: Amos Gilat
Publisher: John Wiley & Sons Inc
expand_more
expand_more
format_list_bulleted
Related questions
Question
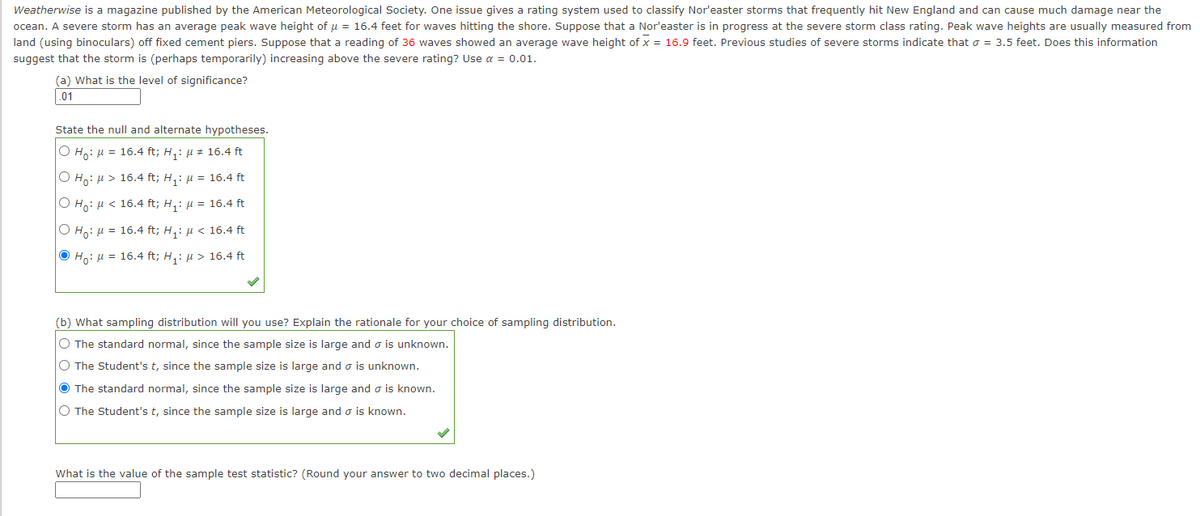

Transcribed Image Text:Weatherwise is a magazine published by the American Meteorological Society. One issue gives a rating system used to classify Nor'easter storms that frequently hit New England and can cause much damage near the
ocean. A severe storm has an average peak wave height of u = 16.4 feet for waves hitting the shore. Suppose that a Nor'easter is in progress at the severe storm class rating. Peak wave heights are usually measured from
land (using binoculars) off fixed cement piers. Suppose that a reading of 36 waves showed an average wave height of x = 16.9 feet. Previous studies of severe storms indicate that o = 3.5 feet. Does this information
suggest that the storm is (perhaps temporarily) increasing above the severe rating? Use a = 0.01.
(a) What is the level of significance?
.01
State the null and alternate hypotheses.
Ο Η,: μ= 16.4 ft ; Η, : μ# 16.4 ft
O Ho: H > 16.4 ft; H,: µ = 16.4 ft
Ο H, μ< 16.4 ft; Η, : μ= 16.4 ft
Ο H: μ 16.4 ft; H,: μ < 16.4 ft
O Ho: H = 16.4 ft; H,: µ > 16.4 ft
(b) What sampling distribution will you use? Explain the rationale for your choice of sampling distribution.
O The standard normal, since the sample size is large and o is unknown.
O The Student's t, since the sample size is large and o is unknown.
O The standard normal, since the sample size is large and o is known.
O The Student's t, since the sample size is large and o is known.
What is the value of the sample test statistic? (Round your answer to two decimal places.)
Expert Solution
This question has been solved!
Explore an expertly crafted, step-by-step solution for a thorough understanding of key concepts.

This is a popular solution

Trending nowThis is a popular solution!

Step by stepSolved in 2 steps with 2 images

Knowledge Booster

Similar questions
- Can I have a detailed expalanation on the following question? I've included the question and my work in two images. If I've made any mistakes in my work, kindly point them out and explain the method of solving this problem in the correct manner. Thank you!arrow_forwardFor each situation, state the null and alternative hypotheses: (Type "mu" for the symbol ?μ , e.g. mu >> 1 for the mean is greater than 1, mu << 1 for the mean is less than 1, mu not = 1 for the mean is not equal to 1. Please do not include units such as "mm" or "$" in your answer.) (a) The diameter of a spindle in a small motor is supposed to be 4.2 millimeters (mm) with a standard deviation of 0.12 mm. If the spindle is either too small or too large, the motor will not work properly. The manufacturer measures the diameter in a sample of 19 spindles to determine whether the mean diameter has moved away from the required measurement. Suppose the sample has an average diameter of 4.3 mm.?0 : ?? : (b) Harry thinks that prices in Caldwell are higher than the rest of the country. He reads that the nationwide average price of a certain brand of laundry detergent is $20.75 with a standard deviation of $2.27. He takes a sample from 3 local Caldwell stores and finds the average…arrow_forwardThe national average SAT score is roughly 1500. We would like to see if the high school seniors who apply to Duke have higher than average SAT scores. We randomly sample 100 applicants' files and record their SAT scores. Which of the following is the correct set of hypotheses for this research question? Hint: think about how many samples we have data from. H0: μ = 1500; HA: μ ≠ 1500 H0: p = 1500; HA: p > 1500 H0: μ Duke= μ National; HA: μ Duke> μ National H0: x = 1500; HA: x > 1500 H0: μ = 1500; HA: μ > 1500arrow_forward
- 5 O Ĵ Ⓒ GeoGebr X Ho: ? a) Identify the null and alternative hypotheses? 533 93 C www.myopenmath.com/assess2/ O My files - OneDrive South Puget Sound.... Funimation - Watch... Sy Graphing Calculato... m HBO Max You are concerned that nausea may be a side effect of Tamiflu, but you cannot just give Tamiflu to patients with the flu and say that nausea is a side effect if people become nauseous. This is because nausea is common for people who have the flu. From past studies you know that about 33% of people who get the flu experience nausea. You collected data on 2371 patients who were taking Tamiflu to relieve symtoms of the flu, and found that 841 experienced nausea. Use a 0.01 significance level to test the claim that the percentage of people who take Tamiflu for the relief of flu symtoms and experience nausea is greater than 33%. *.** ▸ Ezra Mill X HH Chief Be X V H₁: ? V b) What type of hypothesis test should you conduct (left-, right-, or two-tailed)? Oleft-tailed Gcrack ho X…arrow_forwardPlease solve for parts D, E, and F.arrow_forwardHo: µ = 35000, H1: µ < 35000, ơ = 4700, a = 32450, n 30. Test %3D the claim at 0.05 significance. Find the test statistic Round to three decimal places. Reject or fail to reject the null hypothesis?arrow_forward
- State the null and alternative hypotheses: H0: μ | ≠, <, =, or > _________ H1: μ | ≠, ≥ , =, ≤ , or = _________arrow_forwardPlease help. I’m trying to complete these problems as review and they’re stumping me. No code please just matharrow_forwardUse the information given and the eight-step approach to test the hypotheses. Let a = .01. Họ : µ = 36 H :µ # 36 n = 63 x = 38.4 o = 5.93 a Appendix A Statistical Tables (Round your answer to 2 decimal places, e.g. 1.75.) The value of the test statistic is and wearrow_forward
- the national average SAT score is roughly 1500. We would like to see if the high school seniors who apply to Duke have higher than average SAT scores. We randomly sample 100 applicants' files and record their SAT scores. Which of the following is the correct set of hypotheses for this research question? Hint: think about how many samples we have data from. H0: μ = 1500; HA: μ ≠ 1500 H0: p = 1500; HA: p > 1500 H0: x = 1500; HA: x > 1500 H0: μ Duke= μ National; HA: μ Duke> μ National H0: μ = 1500; HA: μ > 1500arrow_forwardM = 36 X = 24.6 σ=12 Ho: μ ≤20 H.: μ>20 Refer to Exhibit 9-1. The test statistic equals 2.3 0.38 b. C. d. -0.38arrow_forwardPlease help me in solving point d and c.arrow_forward
arrow_back_ios
SEE MORE QUESTIONS
arrow_forward_ios
Recommended textbooks for you
- MATLAB: An Introduction with ApplicationsStatisticsISBN:9781119256830Author:Amos GilatPublisher:John Wiley & Sons Inc
 Probability and Statistics for Engineering and th...StatisticsISBN:9781305251809Author:Jay L. DevorePublisher:Cengage Learning
 Statistics for The Behavioral Sciences (MindTap C...StatisticsISBN:9781305504912Author:Frederick J Gravetter, Larry B. WallnauPublisher:Cengage Learning
  Elementary Statistics: Picturing the World (7th E...StatisticsISBN:9780134683416Author:Ron Larson, Betsy FarberPublisher:PEARSON
 The Basic Practice of StatisticsStatisticsISBN:9781319042578Author:David S. Moore, William I. Notz, Michael A. FlignerPublisher:W. H. Freeman
 Introduction to the Practice of StatisticsStatisticsISBN:9781319013387Author:David S. Moore, George P. McCabe, Bruce A. CraigPublisher:W. H. Freeman
MATLAB: An Introduction with Applications
Statistics
ISBN:9781119256830
Author:Amos Gilat
Publisher:John Wiley & Sons Inc
Probability and Statistics for Engineering and th...
Statistics
ISBN:9781305251809
Author:Jay L. Devore
Publisher:Cengage Learning
Statistics for The Behavioral Sciences (MindTap C...
Statistics
ISBN:9781305504912
Author:Frederick J Gravetter, Larry B. Wallnau
Publisher:Cengage Learning
Elementary Statistics: Picturing the World (7th E...
Statistics
ISBN:9780134683416
Author:Ron Larson, Betsy Farber
Publisher:PEARSON
The Basic Practice of Statistics
Statistics
ISBN:9781319042578
Author:David S. Moore, William I. Notz, Michael A. Fligner
Publisher:W. H. Freeman
Introduction to the Practice of Statistics
Statistics
ISBN:9781319013387
Author:David S. Moore, George P. McCabe, Bruce A. Craig
Publisher:W. H. Freeman