
MATLAB: An Introduction with Applications
6th Edition
ISBN: 9781119256830
Author: Amos Gilat
Publisher: John Wiley & Sons Inc
expand_more
expand_more
format_list_bulleted
Related questions
Question
Here is the data with the questions. I need answer od this 3 question.
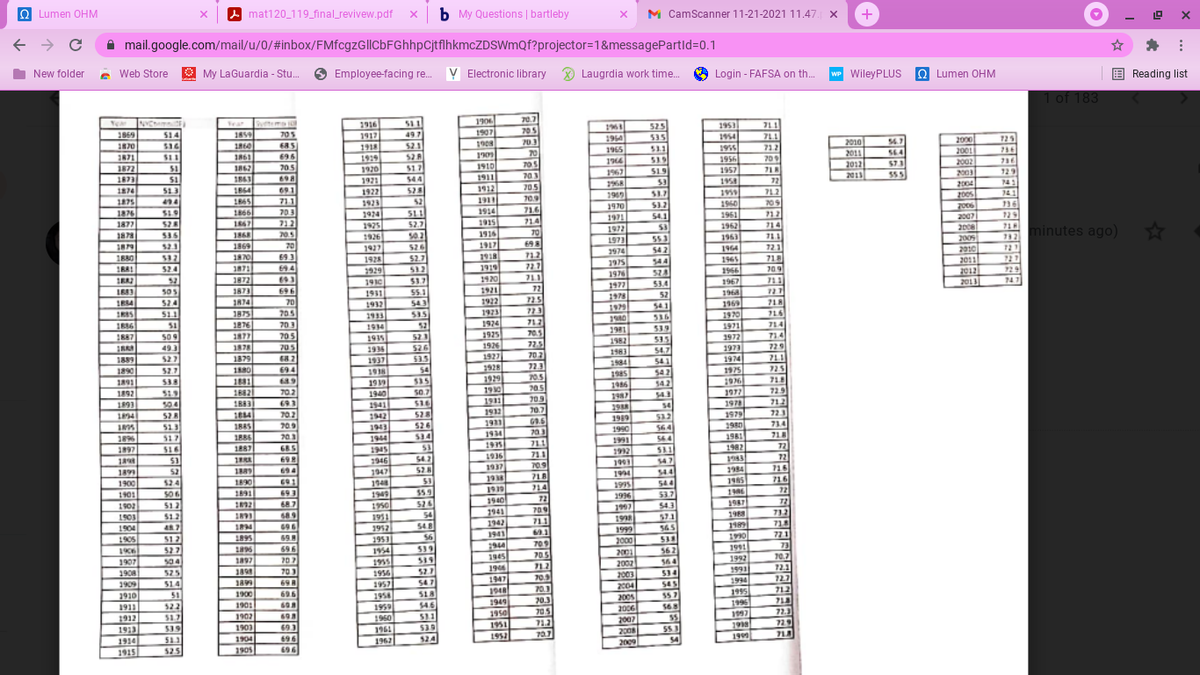

Transcribed Image Text:The image presents a comprehensive table of data across multiple columns, organized by year and associated with various numerical values. The data appears to be split into several sections, each representing a different period. Below is the transcription of the data:
**First Column:**
- Year: 1869 to 1915
- Corresponding Values: Range from 49.2 to 53.1
**Second Column:**
- Year: 1860 to 1903
- Corresponding Values: Range from 68.2 to 70.8
**Third Column:**
- Year: 1903 to 1951
- Corresponding Values: Range from 69.7 to 72.9
**Fourth Column:**
- Year: 1912 to 1991
- Corresponding Values: Range from 70.3 to 72.3
**Fifth Column:**
- Year: 1951 to 2009
- Corresponding Values: Range from 52.2 to 56
**Small Table (Upper Right):**
- Year: 2010 to 2013
- Corresponding Values: Range from 55.3 to 56.7
**Small Table (Lower Right):**
- Year: 2000 to 2013
- Corresponding Values: Range from 70.3 to 74.7
Each column seems to represent distinct datasets, possibly related to measurements or indices recorded over time. The small tables on the right provide a more focused view for recent years.

Transcribed Image Text:```plaintext
Project-3: Historical Temperature Trends (Hypothesis test)
Use the following historical data for the annual average temperature records for New York City, USA to answer the following questions. For each year, the data value is calculated by taking the average of the daily high temperature readings from every day of that year, observed in a specific location, e.g., Central Park for New York and Observatory Hill for Sydney. The data are sorted by year in ascending order. For your convenience, temperatures have been converted to the Fahrenheit scale. You can find the data and the original data sources at https://lagcc-cuny.digication.com/project_data/Temperature_Trends/
For your convenience the data files are attached along with the assignment.
Q1) Let
Expert Solution
This question has been solved!
Explore an expertly crafted, step-by-step solution for a thorough understanding of key concepts.

Step by stepSolved in 7 steps with 3 images

Knowledge Booster

Similar questions
- Brandon's score in the high jump at a track and field event showed that he was only able to jump higher than 27% of his competitors. Find the z score for Brandon's high jump score.arrow_forwardLast week a gumball machine dispensed 10 white gumballs and 16 other gumballs. Considering this data, how many of the next 78 gumballs dispensed should you expect to be white gumballs?arrow_forwardOne of the basketball coaches at Cypress College wanted to see if Cypress College's Strength & Exercise class was increasing the weight that a player could bench press. The basketball coach randomly selected some of his players and determined how much they could bench press before taking the class. Then after completing the class, he again determined the weight that they could now bench press. The data for these players is given in the table below. Test whether the Strength and Exercise class is increasing the amount of weight that the players can bench press at the a=0.05 level of significance. Player Player 1 Player 2 Player 3 Player 4 Pounds Lifted Before 205 241 338 368 [ Select] ANOVA 2-SampFTest 252 330 360 2-SampTTest X^2-Test 2-PropZTest T-Test [ Select ] P-Value [ Select] Conclusionarrow_forward
- The value of a certain car when it was brand new with 0 mileage was $17,000 but the value dropped to $4,000 when the car acounulated 80,000 miles shown in the scatter plot below. Car's Mleage and Value S17.000 $2,000 Mileage Based on the data in the scatter plot, at what mileage was the car worth about $12,000? O 20,000 miles O 30,000 miles O 60,000 miles O 80,000 milesarrow_forwardHi i’m in grade 12 Data Management and i need help with this practice questionarrow_forwardhow did you find the Z score?arrow_forward
- An insurance company crashed four cars in succession at 5 miles per hour. The cost of repair for each of the crashes was $421,$465,$412,$218. Compute the range of dataarrow_forwardThe whole data set will be in the two picturesarrow_forwardI can't understand why the data is the percentage of surveyed parents.arrow_forward
- A mathematics professor lost a test paper belonging to one of her students. She remembered that the mean score for the class of 20 was 81 and that the sum of the 19 other scores was 1530. What was the grade on the paper she lost?arrow_forwardHillary and Devin will collect data to find out where the seventh-grade students should take their field trip. Which group should Hillary and Devin survey to collect the best data?arrow_forwardA student has an average of 81 on four equally weighted tests she has taken in her statistics class. What grade must she receive on her fifth test if she needs an average score of 83? Answer is 91? Can you help me to explain to me step by step?arrow_forward
arrow_back_ios
SEE MORE QUESTIONS
arrow_forward_ios
Recommended textbooks for you
- MATLAB: An Introduction with ApplicationsStatisticsISBN:9781119256830Author:Amos GilatPublisher:John Wiley & Sons Inc
 Probability and Statistics for Engineering and th...StatisticsISBN:9781305251809Author:Jay L. DevorePublisher:Cengage Learning
 Statistics for The Behavioral Sciences (MindTap C...StatisticsISBN:9781305504912Author:Frederick J Gravetter, Larry B. WallnauPublisher:Cengage Learning
  Elementary Statistics: Picturing the World (7th E...StatisticsISBN:9780134683416Author:Ron Larson, Betsy FarberPublisher:PEARSON
 The Basic Practice of StatisticsStatisticsISBN:9781319042578Author:David S. Moore, William I. Notz, Michael A. FlignerPublisher:W. H. Freeman
 Introduction to the Practice of StatisticsStatisticsISBN:9781319013387Author:David S. Moore, George P. McCabe, Bruce A. CraigPublisher:W. H. Freeman
MATLAB: An Introduction with Applications
Statistics
ISBN:9781119256830
Author:Amos Gilat
Publisher:John Wiley & Sons Inc
Probability and Statistics for Engineering and th...
Statistics
ISBN:9781305251809
Author:Jay L. Devore
Publisher:Cengage Learning
Statistics for The Behavioral Sciences (MindTap C...
Statistics
ISBN:9781305504912
Author:Frederick J Gravetter, Larry B. Wallnau
Publisher:Cengage Learning
Elementary Statistics: Picturing the World (7th E...
Statistics
ISBN:9780134683416
Author:Ron Larson, Betsy Farber
Publisher:PEARSON
The Basic Practice of Statistics
Statistics
ISBN:9781319042578
Author:David S. Moore, William I. Notz, Michael A. Fligner
Publisher:W. H. Freeman
Introduction to the Practice of Statistics
Statistics
ISBN:9781319013387
Author:David S. Moore, George P. McCabe, Bruce A. Craig
Publisher:W. H. Freeman