
MATLAB: An Introduction with Applications
6th Edition
ISBN: 9781119256830
Author: Amos Gilat
Publisher: John Wiley & Sons Inc
expand_more
expand_more
format_list_bulleted
Related questions
Question
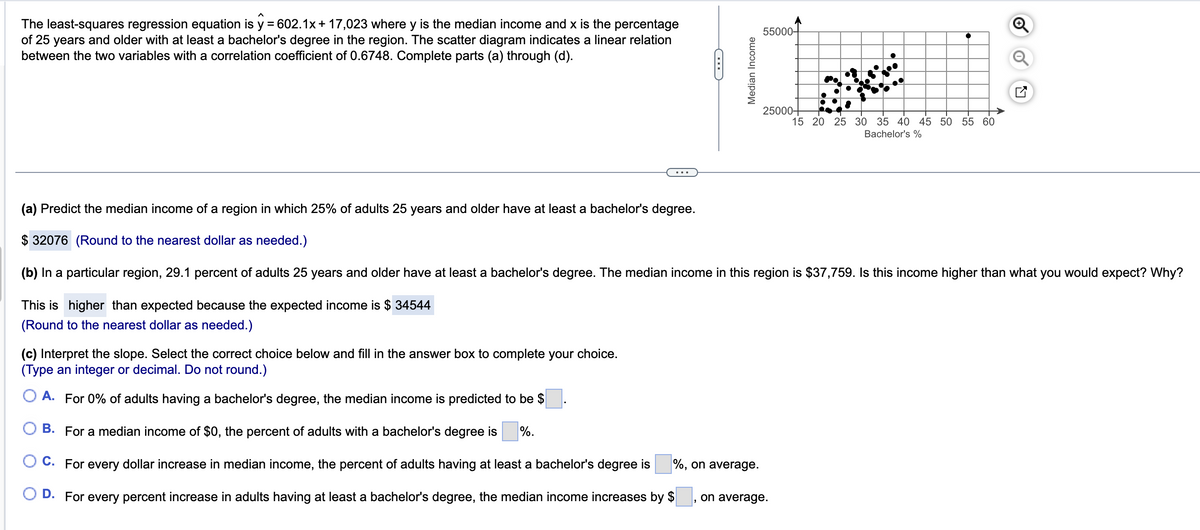

Transcribed Image Text:The least-squares regression equation is y = 602.1x + 17,023 where y is the median income and x is the percentage
of 25 years and older with at least a bachelor's degree in the region. The scatter diagram indicates a linear relation
between the two variables with a correlation coefficient of 0.6748. Complete parts (a) through (d).
C
Median Income
55000-
25000
●
(c) Interpret the slope. Select the correct choice below and fill in the answer box to complete your choice.
(Type an integer or decimal. Do not round.)
A. For 0% of adults having a bachelor's degree, the median income is predicted to be $
B. For a median income of $0, the percent of adults with a bachelor's degree is %.
O C. For every dollar increase in median income, the percent of adults having at least a bachelor's degree is %, on average.
OD. For every percent increase in adults having at least a bachelor's degree, the median income increases by $,
on average.
15 20 25 30 35 40 45 50 55 60
Bachelor's %
U
(a) Predict the median income of a region in which 25% of adults 25 years and older have at least a bachelor's degree.
$32076 (Round to the nearest dollar as needed.)
(b) In a particular region, 29.1 percent of adults 25 years and older have at least a bachelor's degree. The median income in this region is $37,759. Is this income higher than what you would expect? Why?
This is higher than expected because the expected income is $ 34544
(Round to the nearest dollar as needed.)
Expert Solution
This question has been solved!
Explore an expertly crafted, step-by-step solution for a thorough understanding of key concepts.

This is a popular solution

Trending nowThis is a popular solution!

Step by stepSolved in 5 steps with 8 images

Knowledge Booster

Similar questions
- The scatter plot below shows the average cost of a designer jacket in a sample of years between 2000 and 2015. The least squares regression line modeling this data is given by yˆ=−4815+3.765x. A scatterplot has a horizontal axis labeled Year from 2005 to 2015 in increments of 5 and a vertical axis labeled Price ($) from 2660 to 2780 in increments of 20. The following points are plotted: (2003, 2736); (2004, 2715); (2007, 2675); (2009, 2719); (2013, 270). All coordinates are approximate. Interpret the slope of the least squares regression line. Select the correct answer below: 1.The average cost of a designer jacket decreased by $3.765 each year between 2000 and 2015. 2.The average cost of a designer jacket increased by $3.765 each year between 2000 and 2015. 3.The average cost of a designer jacket decreased by $4815 each year between 2000 and 2015. 4. The average cost of a designer jacket increased by $4815 each year between 2000 and…arrow_forwardFrom a regression equation r2= 0.39 and the slope = -2.8 What is the linear correlation coefficient r?arrow_forwardA regression modrel examining the amount of distance a long-ddistance runner runs (in miles) to predict the amount of fluid the runner drinks (ounces0 has a slope of 4.6. Which interpretation is appropiate? The correlation is needed to interpret this value. Arunner drinks minimum of 4.6 oz. We predict 4.6 miles for every ounce that drunk. We predict for every mile run, the runner drinks 4.6 more ounces. Each mile adds 4.6 more ounces.arrow_forward
- The least-squares regression equation is y = 743.3x+ 12,990 where y is the median income and x is the percentage of 25 years and older with at least a bachelor's degree in the region. The scatter diagram indicates a linear relation between the two variables with a correlation coefficient of 0.7921. Complete parts (a) through (d). 55000- 20000- 15 20 25 30 35 40 45 50 55 60 Bachelor's % (a) Predict the median income of a region in which 20% of adults 25 years and older have at least a bachelor's degree. $ (Round to the nearest dollar as needed.) Median Incomearrow_forwardThe least-squares regression equation is y=620.6x+16,624 where y is the median income and x is the percentage of 25 years and older with at least a bachelor's degree in the region. The scatter diagram indicates a linear relation between the two variables with a correlation coefficient of 0.7004. In a particular region, 28.3 percent of adults 25 years and older have at least a bachelor's degree. The median income in this region is $37,389. Is this income higher than what you would expect? Why?arrow_forwardThe least-squares regression equation is y=761.7x+13,208 where y is the median income and x is the percentage of 25 years and older with at least a bachelor's degree in the region. The scatter diagram indicates a linear relation between the two variables with a correlation coefficient of 0.7483. Predict the median income of a region in which 20% of adults 25 years and older have at least a bachelor's degree.arrow_forward
- The table shows a part of an output of a linear regression model predicting the average fare on different flight routes. Data Table Regression Table Coefficient Constant 95.80976147 COUPON −9.61654124 DISTANCE 0.080733811 PAX −0.000167343 What is the difference in prediction of the following two routes? Route A that is 3,000 miles, with COUPON=1.5 and PAX=6,000 Route B that is 3,000 miles, with COUPON=1.2 and PAX=6,000.arrow_forwardIf a correlation isr= 0.00, then SP = 0 and the regression equation is O Ý =X +0 O Ý =X + X O Ý =0 + X O Ý =Ÿ + 0arrow_forwardThe coefficient of correlation in a simple regression analysis is = -0.6. The coefficient of determination for this regression would be 0.36 - 0.36 0.6 0.13 O 0.6 or + 0.6arrow_forward
- x = number of traffic tickets y = Cost of auto insurance A test of linear correlation between traffic tickets and insurance cost produces a linear correlation coefficient of r = 0.705. Determine weather the regression line has a positive slope, or a negative slopearrow_forwardThe least-squares regression equation is y=784.6x+12,431 where y is the median income and x is the percentage of 25 years and older with at least a bachelor's degree in the region. The scatter diagram indicates a linear relation between the two variables with a correlation coefficient of 0.7962. In a particular region, 26.5 percent of adults 25 years and older have at least a bachelor's degree. The median income in this region is $29,889. Is this income higher or lower than what you would expect? Why?arrow_forwardDevelop a scatterplot and explore the correlation between customer age and net sales by each type of customer (regular/promotion). Use the horizontal axis for the customer age to graph. Find the linear regression line that models the data by each type of customer. Round the rate of changes (slopes) to two decimal places and interpret them in terms of the relation between the change in age and the change in net sales. What can you conclude? Hint: Rate of Change = Vertical Change / Horizontal Change = Change in y / Change in xarrow_forward
arrow_back_ios
SEE MORE QUESTIONS
arrow_forward_ios
Recommended textbooks for you
- MATLAB: An Introduction with ApplicationsStatisticsISBN:9781119256830Author:Amos GilatPublisher:John Wiley & Sons Inc
 Probability and Statistics for Engineering and th...StatisticsISBN:9781305251809Author:Jay L. DevorePublisher:Cengage Learning
 Statistics for The Behavioral Sciences (MindTap C...StatisticsISBN:9781305504912Author:Frederick J Gravetter, Larry B. WallnauPublisher:Cengage Learning
  Elementary Statistics: Picturing the World (7th E...StatisticsISBN:9780134683416Author:Ron Larson, Betsy FarberPublisher:PEARSON
 The Basic Practice of StatisticsStatisticsISBN:9781319042578Author:David S. Moore, William I. Notz, Michael A. FlignerPublisher:W. H. Freeman
 Introduction to the Practice of StatisticsStatisticsISBN:9781319013387Author:David S. Moore, George P. McCabe, Bruce A. CraigPublisher:W. H. Freeman
MATLAB: An Introduction with Applications
Statistics
ISBN:9781119256830
Author:Amos Gilat
Publisher:John Wiley & Sons Inc
Probability and Statistics for Engineering and th...
Statistics
ISBN:9781305251809
Author:Jay L. Devore
Publisher:Cengage Learning
Statistics for The Behavioral Sciences (MindTap C...
Statistics
ISBN:9781305504912
Author:Frederick J Gravetter, Larry B. Wallnau
Publisher:Cengage Learning
Elementary Statistics: Picturing the World (7th E...
Statistics
ISBN:9780134683416
Author:Ron Larson, Betsy Farber
Publisher:PEARSON
The Basic Practice of Statistics
Statistics
ISBN:9781319042578
Author:David S. Moore, William I. Notz, Michael A. Fligner
Publisher:W. H. Freeman
Introduction to the Practice of Statistics
Statistics
ISBN:9781319013387
Author:David S. Moore, George P. McCabe, Bruce A. Craig
Publisher:W. H. Freeman