
MATLAB: An Introduction with Applications
6th Edition
ISBN: 9781119256830
Author: Amos Gilat
Publisher: John Wiley & Sons Inc
expand_more
expand_more
format_list_bulleted
Related questions
Question
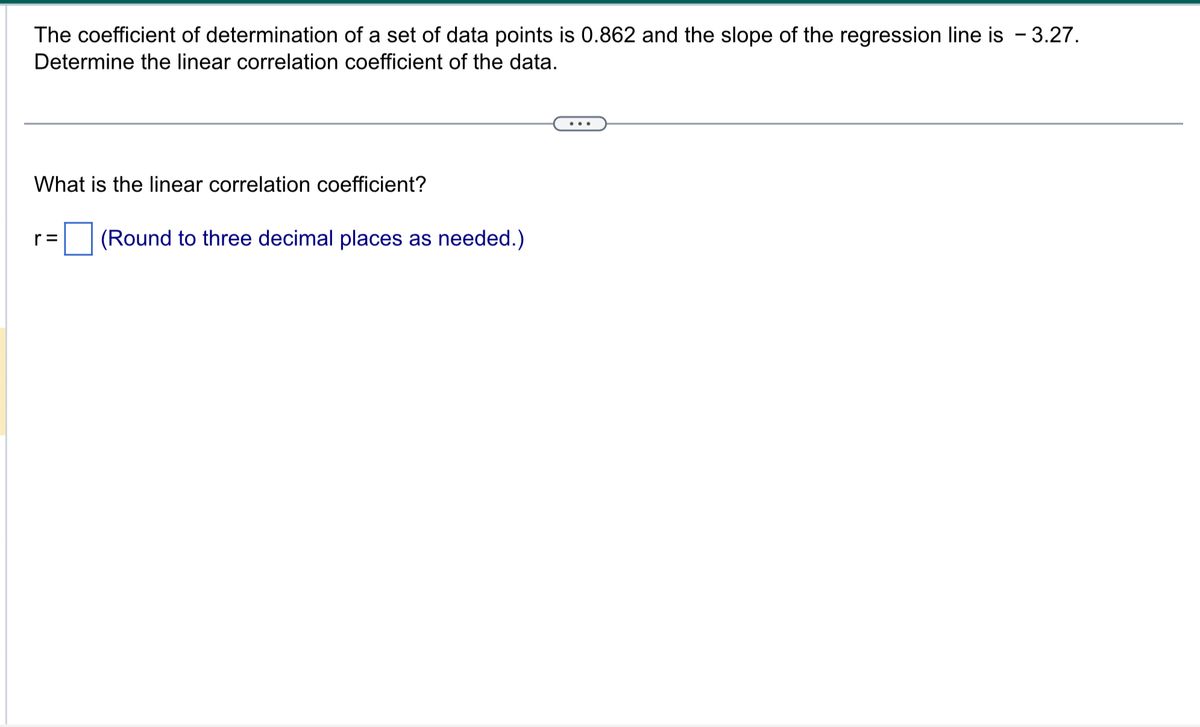

Transcribed Image Text:The coefficient of determination of a set of data points is 0.862 and the slope of the regression line is - 3.27.
Determine the linear correlation coefficient of the data.
What is the linear correlation coefficient?
r= (Round to three decimal places as needed.)
Expert Solution
This question has been solved!
Explore an expertly crafted, step-by-step solution for a thorough understanding of key concepts.

This is a popular solution

Trending nowThis is a popular solution!

Step by stepSolved in 3 steps

Knowledge Booster

Similar questions
- You generate a scatter plot using Excel. You then have Excel plot the trend line and report the equation and the r2r2 value. The regression equation is reported asy=−99.98x+51.42y=-99.98x+51.42and the r2=0.2704r2=0.2704.What is the correlation coefficient for this data set?r =arrow_forwardYou generate a scatter plot using Minitab. You then have Minitab plot the regression line and report the equation and the r2 value. The regression equation is reported as y=43.41x+77.98 and the r2=0.2025.What is the correlation coefficient for this data set? r =arrow_forwardFor a data set of brain volumes (cm°) and IQ scores of six males, the linear correlation coefficient is r= 0.647. Use the table available below to find the critical values of r. Based on a comparison of the linear correlation coefficient r a values, what do you conclude about a linear correlation? Click the icon to view the table of critical values of r. The critical values are Table of Critical Values of r Number of Pairs of Data n Critical Value of r 4 0.950 0.878 6. 0.811 7 0.754 8 0.707 9. 0.666 10 0.632 11 0.602 12 0.576arrow_forward
- Use the value of the linear correlation coefficient r to find the coefficient of determination and the percentage of the total variation that can be explained by the linear relationship between the two variables. r=0.947, where x = distance in miles and y=fare in dollars What is the value of the coefficient of determination? The coefficient of determination is (Round to four decimal places as needed.) G Camera Search your device, apps, settings, web.... G Docs Chrome Gmail 1)arrow_forwardI need the right answer to this problem.arrow_forwardThe regression equation is computed for a set of n = 18 pairs of X and Y values with a correlation of r = 0.50 and SSy = 48. Find the standard error of estimate for the regression equation. The standard error of estimate = How big would the standard error be if the sample size were n = 66? The standard error of estimate =arrow_forward
- From a regression equation r2= 0.39 and the slope = -2.8 What is the linear correlation coefficient r?arrow_forwardUse the value of the linear correlation coefficient r to find the coefficient of determination and the percentage of the total variation that can be explained by the linear relationship between the two variables. r=0.853arrow_forwardUse the value of the linear correlation coefficient r to find the coefficient of determination and the percentage of the total variation that can be explained by the linear relationship between the two variables. r = 0.173 What is the value of the coefficient of determination? 2 = (Round to four decimal places as needed.)arrow_forward
- For a set of correlated data, you calculate that the correlation coefficient (r) is -0.87. What percent of the variation in the dependent variable is explained by variation in the independent variable? D2L requires decimal format. Convert your percentage to a decimal rounded to the third place. i.e. 51.2218% = 0.512.arrow_forwardyou are going to buy some calves. What should a healthy weight be? let x be the age of the calf (in weeks), and let y be the weight of the calf (in kg) the calves you want to buy are 12 weeks old. Predict the healthy weight you should expect. x=1 3 10 16 26 36 y=42 50 75 100 150 200 state the correlation coefficient and regression line equation.arrow_forwardUse the value of the linear correlation coefficient to calculate the coefficient of determination. What does this tell you about the explained variation of the data about the regression line? About the unexplained variation? r=0.926arrow_forward
arrow_back_ios
SEE MORE QUESTIONS
arrow_forward_ios
Recommended textbooks for you
- MATLAB: An Introduction with ApplicationsStatisticsISBN:9781119256830Author:Amos GilatPublisher:John Wiley & Sons Inc
 Probability and Statistics for Engineering and th...StatisticsISBN:9781305251809Author:Jay L. DevorePublisher:Cengage Learning
 Statistics for The Behavioral Sciences (MindTap C...StatisticsISBN:9781305504912Author:Frederick J Gravetter, Larry B. WallnauPublisher:Cengage Learning
  Elementary Statistics: Picturing the World (7th E...StatisticsISBN:9780134683416Author:Ron Larson, Betsy FarberPublisher:PEARSON
 The Basic Practice of StatisticsStatisticsISBN:9781319042578Author:David S. Moore, William I. Notz, Michael A. FlignerPublisher:W. H. Freeman
 Introduction to the Practice of StatisticsStatisticsISBN:9781319013387Author:David S. Moore, George P. McCabe, Bruce A. CraigPublisher:W. H. Freeman
MATLAB: An Introduction with Applications
Statistics
ISBN:9781119256830
Author:Amos Gilat
Publisher:John Wiley & Sons Inc
Probability and Statistics for Engineering and th...
Statistics
ISBN:9781305251809
Author:Jay L. Devore
Publisher:Cengage Learning
Statistics for The Behavioral Sciences (MindTap C...
Statistics
ISBN:9781305504912
Author:Frederick J Gravetter, Larry B. Wallnau
Publisher:Cengage Learning
Elementary Statistics: Picturing the World (7th E...
Statistics
ISBN:9780134683416
Author:Ron Larson, Betsy Farber
Publisher:PEARSON
The Basic Practice of Statistics
Statistics
ISBN:9781319042578
Author:David S. Moore, William I. Notz, Michael A. Fligner
Publisher:W. H. Freeman
Introduction to the Practice of Statistics
Statistics
ISBN:9781319013387
Author:David S. Moore, George P. McCabe, Bruce A. Craig
Publisher:W. H. Freeman