
ENGR.ECONOMIC ANALYSIS
14th Edition
ISBN: 9780190931919
Author: NEWNAN
Publisher: Oxford University Press
expand_more
expand_more
format_list_bulleted
Related questions
Question
8
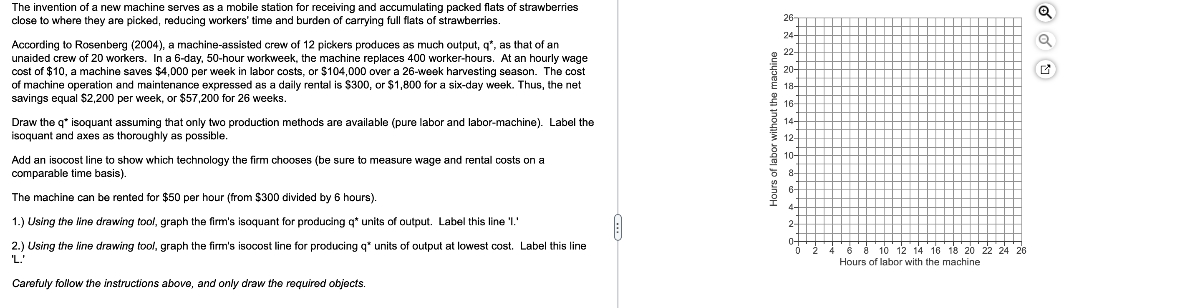

Transcribed Image Text:The invention of a new machine serves as a mobile station for receiving and accumulating packed flats of strawberries
close to where they are picked, reducing workers' time and burden of carrying full flats of strawberries.
According to Rosenberg (2004), a machine-assisted crew of 12 pickers produces as much output, q*, as that of an
unaided crew of 20 workers. In a 6-day, 50-hour workweek, the machine replaces 400 worker-hours. At an hourly wage
cost of $10, a machine saves $4,000 per week in labor costs, or $104,000 over a 26-week harvesting season. The cost
of machine operation and maintenance expressed as a daily rental is $300, or $1,800 for a six-day week. Thus, the net
savings equal $2,200 per week, or $57,200 for 26 weeks.
Draw the q* isoquant assuming that only two production methods are available (pure labor and labor-machine). Label the
isoquant and axes as thoroughly as possible.
Add an isocost line to show which technology the firm chooses (be sure to measure wage and rental costs on a
comparable time basis).
The machine can be rented for $50 per hour (from $300 divided by 6 hours).
1.) Using the line drawing tool, graph the firm's isoquant for producing q* units output. Label this line 'I.'
2.) Using the line drawing tool, graph the firm's isocost line for producing q* units of output at lowest cost. Label this line
'L.'
Carefuly follow the instructions above, and only draw the required objects.
Hours of labor without the machine
26-
24-
22-
20-
E 18-
16-
14
12-
10-
8-
4
2
U-
6 8 10 12 14 16 18 20 22 24 26
Hours of labor with the machine
Q
Expert Solution
This question has been solved!
Explore an expertly crafted, step-by-step solution for a thorough understanding of key concepts.

This is a popular solution

Trending nowThis is a popular solution!

Step by stepSolved in 2 steps with 2 images

Knowledge Booster


Learn more about
Need a deep-dive on the concept behind this application? Look no further. Learn more about this topic, economics and related others by exploring similar questions and additional content below.Similar questions
- calculate sum of the residualsarrow_forwardctors) on of es 1. Relationship of data usage and bill Data Usage(GB/month) 0 10 20 30 Bill($/month) 10 30 50 70 A. Draw the graph, placing data usage horizontally(on the X axis) and bill vertically(On the Y axis). B. How much is the monthly fixed fee? C. How much is the charge per GB? D. What is the Equation that describes the relationship, where data usage is denoted by D, and bill by B? E. How much would be the charge for 50 GB use per month?arrow_forward"Industry organization Agri SA has expressed concern about rising input costs in the agricultural sector, echoing concerns raised by the Agricultural Business Chamber (Agbiz) earlier this week. Agri SA says the cost of direct materials, labour and other overheads are particularly worrying, while Agbiz mentioned how fuel costs are gnawing at agribusiness' profitability". Sunshine markets is producing and selling sweet potatoes and they have been impacted by the rising costs. (A) (C) S1 a) A b) B c) C d) D D2 D'a S2 Da (B) (D) Di D'a $2 $1 Zoe D a If sweet potatoes and potatoes are substitute products, which diagram above illustrates the effect on the sweet potato market of a decrease in the price of potatoes?arrow_forward
- Price Pt Pc E V K W O G H X Quantity Multiple Choice y Z Refer to the diagram, where Sø and Dd are the domestic supply and demand for a product and Pc is the world price of that product. Sd+ Q is the product supply curve after an import quota is imposed. The size of the import quota is vy. Sd Sd+Qarrow_forward1arrow_forwardPlease no written by hand and no emagearrow_forward
- A competitive industry has production processes that generate pollution. ok with studies carried out on the affected population, the marginal costs associated with contamination are constant and CU500. for each unit of the good produced. these costs are associated with lost workdays, illness treatment costs, and the nuisance generated in the population. Currently the production level of the industry is 250 units and the market price is 1,500 (MU/unit). Market studies carried out by companies estimate that if the price rises At 1,800 (mu/unit) the quantity demanded would fall to 200 units and the marginal cost of the production of each company in this new production level is 1,300 (m.u./unit). Assume linearity in market demand and in the marginal costs of production of the companies Graph to justify your answers. A)Determine the optimal production level from the perspective of the whole of the society. Show your result graphically.arrow_forwardhi if the tarrif is 6 then in the solution it is 12 please give me approite solutionarrow_forwardE2arrow_forward
arrow_back_ios
SEE MORE QUESTIONS
arrow_forward_ios
Recommended textbooks for you
 Principles of Economics (12th Edition)EconomicsISBN:9780134078779Author:Karl E. Case, Ray C. Fair, Sharon E. OsterPublisher:PEARSON
 Engineering Economy (17th Edition)EconomicsISBN:9780134870069Author:William G. Sullivan, Elin M. Wicks, C. Patrick KoellingPublisher:PEARSON
 Principles of Economics (MindTap Course List)EconomicsISBN:9781305585126Author:N. Gregory MankiwPublisher:Cengage Learning
 Managerial Economics: A Problem Solving ApproachEconomicsISBN:9781337106665Author:Luke M. Froeb, Brian T. McCann, Michael R. Ward, Mike ShorPublisher:Cengage Learning
 Managerial Economics & Business Strategy (Mcgraw-...EconomicsISBN:9781259290619Author:Michael Baye, Jeff PrincePublisher:McGraw-Hill Education
Principles of Economics (12th Edition)
Economics
ISBN:9780134078779
Author:Karl E. Case, Ray C. Fair, Sharon E. Oster
Publisher:PEARSON
Engineering Economy (17th Edition)
Economics
ISBN:9780134870069
Author:William G. Sullivan, Elin M. Wicks, C. Patrick Koelling
Publisher:PEARSON
Principles of Economics (MindTap Course List)
Economics
ISBN:9781305585126
Author:N. Gregory Mankiw
Publisher:Cengage Learning
Managerial Economics: A Problem Solving Approach
Economics
ISBN:9781337106665
Author:Luke M. Froeb, Brian T. McCann, Michael R. Ward, Mike Shor
Publisher:Cengage Learning
Managerial Economics & Business Strategy (Mcgraw-...
Economics
ISBN:9781259290619
Author:Michael Baye, Jeff Prince
Publisher:McGraw-Hill Education