
MATLAB: An Introduction with Applications
6th Edition
ISBN: 9781119256830
Author: Amos Gilat
Publisher: John Wiley & Sons Inc
expand_more
expand_more
format_list_bulleted
Related questions
Question
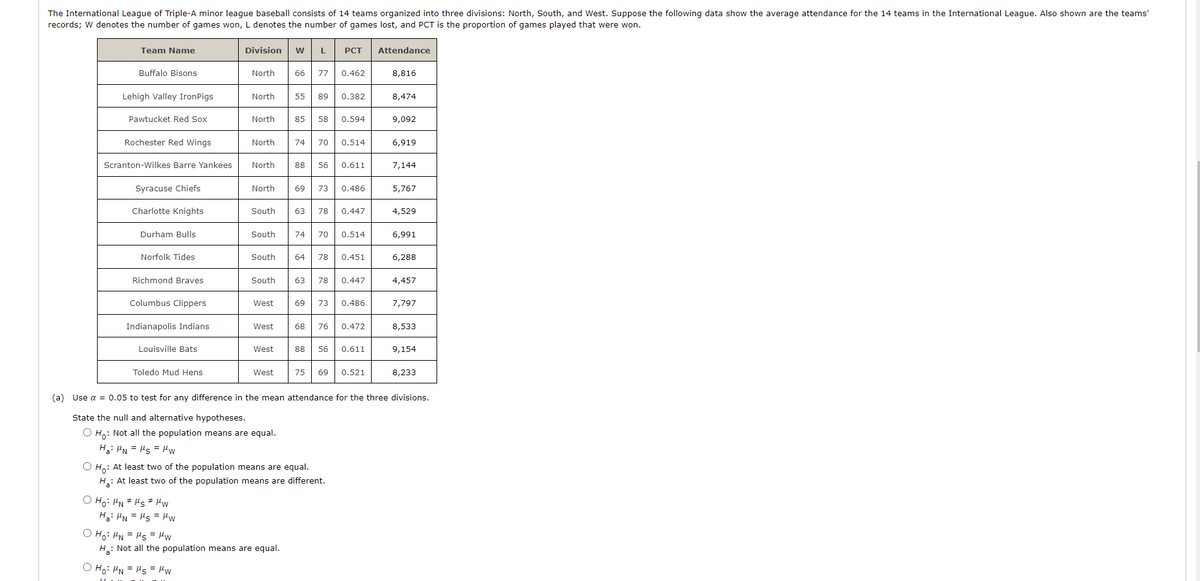

Transcribed Image Text:The International League of Triple-A minor league baseball consists of 14 teams organized into three divisions: North, South, and West. Suppose the following data show the average attendance for the 14 teams in the International League. Also shown are the teams'
records; W denotes the number of games won, L denotes the number of games lost, and PCT is the proportion of games played that were won.
Team Name
Division
w
L
PCT
Attendance
Buffalo Bisons
North
66 77
0.462
8,816
Lehigh Valley IronPigs
North
55
89
0.382
8,474
Pawtucket Red Sox
North
85
58
0.594
9,092
Rochester Red Wings
North
74
70
0.514
6,919
Scranton-Wilkes Barre Yankees
North
88
56
0.611
7,144
Syracuse Chiefs
North
69
73
0.486
5,767
Charlotte Knights
South
63
78
0.447
4,529
Durham Bulls
South
74
70
0.514
6,991
Norfolk Tides
South
64
78
0.451
6,288
Richmond Braves
South
63
78
0.447
4,457
Columbus Clippers
West
69
73
0.486
7,797
Indianapolis Indians
West
68
76
0.472
8,533
Louisville Bats
West
88
56
0.611
9,154
Toledo Mud Hens
West
75
69
0.521
8,233
(a) Use a = 0.05 to test for any difference in the mean attendance for the three divisions.
State the null and alternative hypotheses.
O H,: Not all the population means are equal.
H: HN = Hs = MW
O H,: At least two of the population means are equal.
H.: At least two of the population means are different.
O Ho: HN * Hs * Hw
H: HN = Hs = Mw
O Ho: HN = Hs = Hw
H: Not all the population means are equal.
O Ho: HN = Hs = Hw

Transcribed Image Text:Find the value of the test statistic. (Round your answer to two decimal places.)
Find the p-value. (Round your answer to three decimal places.)
p-value =
State your conclusion.
O Do not reject H.. There is sufficient evidence to conclude that the mean attendance values are not equal for the three divisions.
O Do not reject H.. There is not sufficient evidence to conclude that the mean attendance values are not equal for the three divisions.
O Reject H,. There is sufficient evidence to conclude that the mean attendance values are not equal for the three divisions.
O Reject H,. There is not sufficient evidence to conclude that the mean attendance values are not equal for the three divisions.
(b) Use Fisher's LSD procedure to determine where the differences occur. Use a = 0.05.
Find the value of LSD for each pair of divisions. (Round your answers to two decimal places.)
North and South
LSD
North and West
LSD =
South and West
LSD =
Find the pairwise absolute difference between sample attendance means for each pair of divisions. (Round your answers to the nearest integer.)
=
=
Which attendance means differ significantly? (Select all that apply.)
O There is a significant difference in mean attendance between the North division and the South division.
O There is a significant difference in mean attendance between the North division and the West division.
O There is a significant difference in mean attendance between the South division and the West division.
O There are no significant differences.
Expert Solution
arrow_forward
Step 1


Trending nowThis is a popular solution!

Step by stepSolved in 4 steps with 4 images

Knowledge Booster

Similar questions
- The 2008 general social survey asked a nationally representative sample of 1324 adult americans to report how many hours of television they watch in a typical day. The resulting data are reported in the following table counts. Describe the shape of the distribution of number of hours of TV watching.arrow_forwardFind the original data from the stem-and-leaf plot. Stem leaves 76 358 77 348 78 18arrow_forwardA student was interested in the cigarette-smoking habits of college students and collected data from an unbiased random sample of students. The data are summarized in the following table. Males who smoke Males who do not smoke Females who smoke Females who do not smoke What type of chart best represents the relative class frequencies? Multiple Choice Pie chart Box plot Frequency polygon 10 40 15 60 Scatterplotarrow_forward
- 3. The number of goals scored by Wayne Gretzky was recorded for seasons 1978 – 1999. (Please note the data set has been ordered from smallest to the largest for your convenience). 5, 9, 11, 16, 23, 23, 31, 38, 40, 40, 41, 46, 51, 52, 54, 55, 62, 71, 73, 87, 92 A. Construct a stem-and-leaf display for the data and describe the shape of the distribution (symmetric, skewed left, skewed right, bell-shaped, etc., any obvious outliers). B. What is the fraction of the data that is less than or equal to 31? C. Given that Ex, = 920 and Ex = 52 436 find the mean and standard deviation. D. Find the (i) median, (ii) Q1, (iii)Q:, (iv) the interquartile range (IQR), (v) the lower and upper fences. E. Construct a Box-plot for the data. What are your conclusions about the shape of the distribution? Compare with the results in Part A. F. Would the mean or the median be the most suitable measure to use to represent the central location of this distribution? Give reasons for your answer.arrow_forwardThe number of regular season wins for 10 college football teams in a given season are given below: 15 5 13 | 1 2 10 15 4 7 What is the population variance? Simplify your answer. Round to the nearest hundredth as needed.arrow_forwardPlease help on parts f, g, and h (subpart 3)arrow_forward
- The manager of a book store surveys people who buy mystery novels to see if the store should expand its hours. What is the population and the sample here?arrow_forwardFind the mean for the following group of data items. 5, 6, 2, 8, 1, 3, 4, 8arrow_forwardA: 0, 5, 2, 3, 0, 6, 0, 10, 3, 0 a. Use each sample to make an estimate for the median number of nights students in your school plan to camp next summer.arrow_forward
arrow_back_ios
arrow_forward_ios
Recommended textbooks for you
- MATLAB: An Introduction with ApplicationsStatisticsISBN:9781119256830Author:Amos GilatPublisher:John Wiley & Sons Inc
 Probability and Statistics for Engineering and th...StatisticsISBN:9781305251809Author:Jay L. DevorePublisher:Cengage Learning
 Statistics for The Behavioral Sciences (MindTap C...StatisticsISBN:9781305504912Author:Frederick J Gravetter, Larry B. WallnauPublisher:Cengage Learning
  Elementary Statistics: Picturing the World (7th E...StatisticsISBN:9780134683416Author:Ron Larson, Betsy FarberPublisher:PEARSON
 The Basic Practice of StatisticsStatisticsISBN:9781319042578Author:David S. Moore, William I. Notz, Michael A. FlignerPublisher:W. H. Freeman
 Introduction to the Practice of StatisticsStatisticsISBN:9781319013387Author:David S. Moore, George P. McCabe, Bruce A. CraigPublisher:W. H. Freeman
MATLAB: An Introduction with Applications
Statistics
ISBN:9781119256830
Author:Amos Gilat
Publisher:John Wiley & Sons Inc
Probability and Statistics for Engineering and th...
Statistics
ISBN:9781305251809
Author:Jay L. Devore
Publisher:Cengage Learning
Statistics for The Behavioral Sciences (MindTap C...
Statistics
ISBN:9781305504912
Author:Frederick J Gravetter, Larry B. Wallnau
Publisher:Cengage Learning
Elementary Statistics: Picturing the World (7th E...
Statistics
ISBN:9780134683416
Author:Ron Larson, Betsy Farber
Publisher:PEARSON
The Basic Practice of Statistics
Statistics
ISBN:9781319042578
Author:David S. Moore, William I. Notz, Michael A. Fligner
Publisher:W. H. Freeman
Introduction to the Practice of Statistics
Statistics
ISBN:9781319013387
Author:David S. Moore, George P. McCabe, Bruce A. Craig
Publisher:W. H. Freeman