MATLAB: An Introduction with Applications
6th Edition
ISBN: 9781119256830
Author: Amos Gilat
Publisher: John Wiley & Sons Inc
expand_more
expand_more
format_list_bulleted
Question
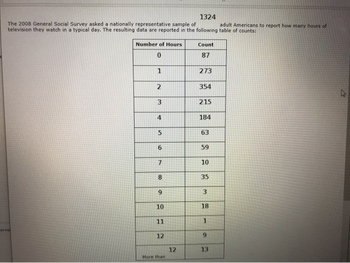
The 2008 general social survey asked a nationally representative sample of 1324 adult americans to report how many hours of television they watch in a typical day. The resulting data are reported in the following table counts. Describe the shape of the distribution of number of hours of TV watching.

Transcribed Image Text:1324
adult Americans to report how many hours of
The 2008 General Social Survey asked a nationally representative sample of
television they watch in a typical day. The resulting data are reported in the following table of counts:
Number of Hours
Count
0
87
1
273
2
354
L
3
215
4
184
5
63
6
59
7
10
8
35
9
3
10
18
11
1
12
9
12
13
More than
Expert Solution
This question has been solved!
Explore an expertly crafted, step-by-step solution for a thorough understanding of key concepts.
Step by stepSolved in 2 steps with 1 images

Knowledge Booster
Similar questions
- The histogram below gives the length of service of members of the Department of Mathematics and Statistics at a particular university. The classes, in years of service, are 0-4.9, 5-9.9, etc., and the vertical axis represents the number of faculty. (a) What percent of the department faculty have 5 or more years of service? (answer in %) (b) If a member of the department is chosen at random to serve on a university committee, what is the probability (in decimal form) that the chosen representitive will have between 10 and 25 years of service? (c) What is the probability the representative above will have less than 15 years of service given that the person has less than 20 years of service?arrow_forwardDraw a histogram for each data set.arrow_forwardTen HR majors had an average grade of 94 on an exam. Fourteen business majors averaged 86, while six finance majors averaged 90 on the same exam. What is the weighted mean for the 30 students taking the exam?arrow_forward
- What is the mean of the following data: 0,0, 1, 1, 1, 2, 2, 2, 3, 3arrow_forwardAccording to the 2016 Consumer Expenditure Survey, Americans spend an average of $1,124 on cellular phone service annually (U.S. Bureau of Labor Statistics website). Suppose that we wish to determine if there are differences in cellular phone expenditures by age group. Therefore, samples of 10 consumers were selected for three age groups (1834, 35- 44, 45 and older). The annual expenditure for each person in the sample is provided in the table below. Click on the datafile logo to reference the data. DATA file 35-44 969 434 1,792 1,500 1,277 1,056 1,922 1,350 18 - 34 1,355 115 1,456 2,045 1,621 994 1,937 1,200 1,567 1,390 a. Compute the mean, variance, and standard deviation for each of these three samples. Round your answers to one decimal place. 18-34 35-44 45+ 1,586 1,415 45 and Older 1,135 956 400 1,374 1,244 825 763 1,192 1,305 1,510 Mean = Variance Standard Deviation b. What observations can be made based on these data? The age group that spends the least amount on cellular phone…arrow_forwardDraw a scatter diagram for a set of data that has an r= -1arrow_forward
- The following data describes grades of students in physics. Complete the frequency table for this data. 91.3.96.7,91.4, 88.4.92.8, 96.7, 82.4, 87.3, 85.7, 95.2, 81.2, 93.2, 85.9, 84.9, 85.8, 83.5, 88.6, 82. I Determine the frequency of each class in the table shown. Grades of Students in Physics Class Frequency 78.0-81.9 82.0-85.9 86.0-89.9 90.0-93.9 94.0-97.9arrow_forwardRaymond wants to estimate the percentage of parents that use cloth diapers. He asks a randomly selected group of 200 parents whether or not they use cloth diapers. What is the data?arrow_forwardA local store owner is interested in finding the mean age of her customers. She randomly surveys 82 customers and records their age. Identify the population, sample, variable, type of variable, parameter, and statistic.arrow_forward
arrow_back_ios
SEE MORE QUESTIONS
arrow_forward_ios
Recommended textbooks for you
 MATLAB: An Introduction with ApplicationsStatisticsISBN:9781119256830Author:Amos GilatPublisher:John Wiley & Sons Inc
 Probability and Statistics for Engineering and th...StatisticsISBN:9781305251809Author:Jay L. DevorePublisher:Cengage Learning
 Statistics for The Behavioral Sciences (MindTap C...StatisticsISBN:9781305504912Author:Frederick J Gravetter, Larry B. WallnauPublisher:Cengage Learning
 Elementary Statistics: Picturing the World (7th E...StatisticsISBN:9780134683416Author:Ron Larson, Betsy FarberPublisher:PEARSON
 The Basic Practice of StatisticsStatisticsISBN:9781319042578Author:David S. Moore, William I. Notz, Michael A. FlignerPublisher:W. H. Freeman
 Introduction to the Practice of StatisticsStatisticsISBN:9781319013387Author:David S. Moore, George P. McCabe, Bruce A. CraigPublisher:W. H. Freeman

MATLAB: An Introduction with Applications
Statistics
ISBN:9781119256830
Author:Amos Gilat
Publisher:John Wiley & Sons Inc

Probability and Statistics for Engineering and th...
Statistics
ISBN:9781305251809
Author:Jay L. Devore
Publisher:Cengage Learning

Statistics for The Behavioral Sciences (MindTap C...
Statistics
ISBN:9781305504912
Author:Frederick J Gravetter, Larry B. Wallnau
Publisher:Cengage Learning

Elementary Statistics: Picturing the World (7th E...
Statistics
ISBN:9780134683416
Author:Ron Larson, Betsy Farber
Publisher:PEARSON

The Basic Practice of Statistics
Statistics
ISBN:9781319042578
Author:David S. Moore, William I. Notz, Michael A. Fligner
Publisher:W. H. Freeman

Introduction to the Practice of Statistics
Statistics
ISBN:9781319013387
Author:David S. Moore, George P. McCabe, Bruce A. Craig
Publisher:W. H. Freeman