
A First Course in Probability (10th Edition)
10th Edition
ISBN: 9780134753119
Author: Sheldon Ross
Publisher: PEARSON
expand_more
expand_more
format_list_bulleted
Related questions
Question
Show all steps.
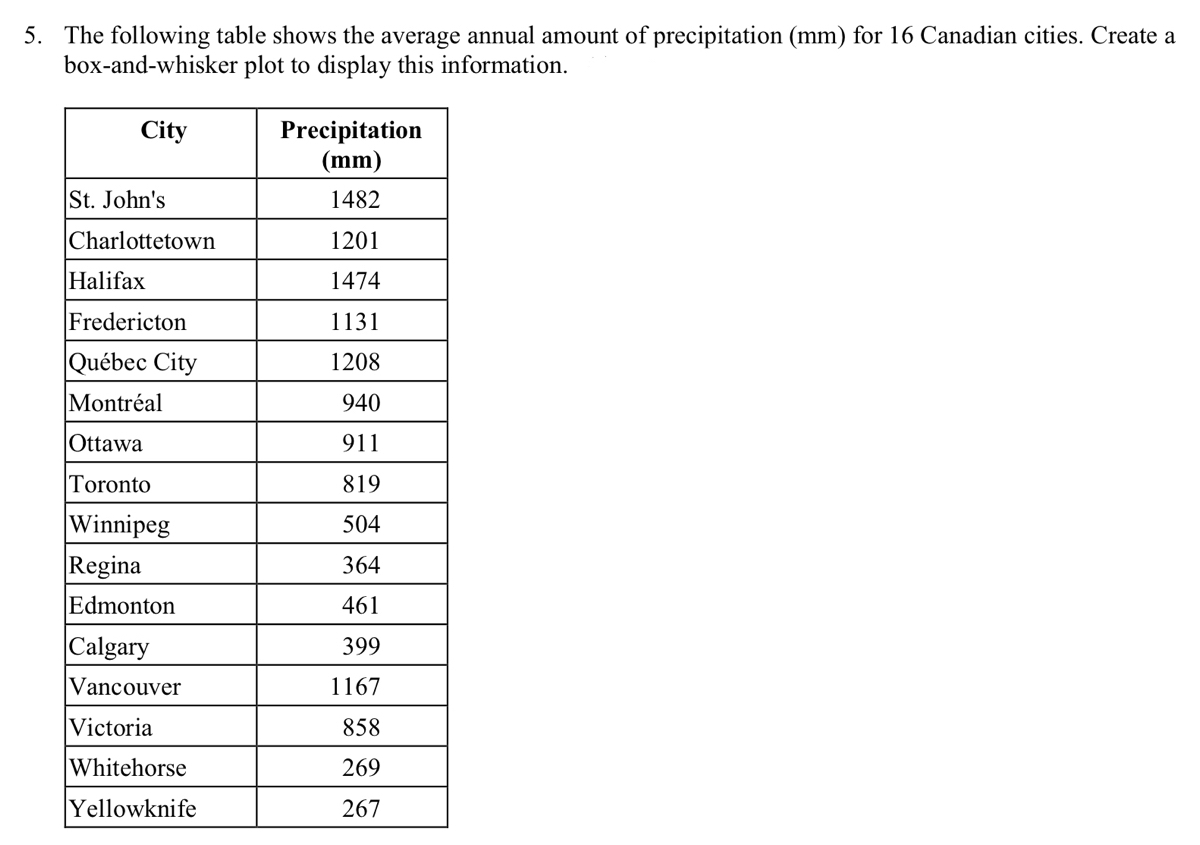

Transcribed Image Text:5. The following table shows the average annual amount of precipitation (mm) for 16 Canadian cities. Create a
box-and-whisker plot to display this information.
City
Precipitation
(mm)
St. John's
1482
Charlottetown
1201
Halifax
1474
Fredericton
1131
|Québec City
1208
Montréal
940
Ottawa
911
Toronto
819
Winnipeg
Regina
504
364
Edmonton
461
Calgary
399
Vancouver
1167
Victoria
858
Whitehorse
269
Yellowknife
267
Expert Solution
This question has been solved!
Explore an expertly crafted, step-by-step solution for a thorough understanding of key concepts.

This is a popular solution

Trending nowThis is a popular solution!

Step by stepSolved in 4 steps with 1 images

Knowledge Booster

Similar questions
- What is r for each of the equations?arrow_forwardPlot the following six points: (- 5,4) (1, 3) (– 2, – 1) (4,0) (2,– 3) (0,-2) 4. 2. -1arrow_forwardIdentify the two variables in the example. For direction of variable, put an arrow pointing either up or down to show what direction the variable goes in. For relationship, write “positive” or “negative” to indicate what kind of relationship the two variables have with each other. A study finds the more research papers a person has written in their lifetime, the higher their score on a math test. Variable 1: Direction of variable 1: Variable 2: Direction of variable 2: Relationship:arrow_forward
- Please answer ASAP PLEASEarrow_forwardMatch these values of r with the accompanying scatterplots: 0.42, - 0.781, -1, 1, and 0.995. Click the icon to view the scatterplots. i Scatterplots Match the values of r to the scatterplots. Scatterplot 1, r= Scatterplot 1 Scatterplot 2 Scatterplot 3 Scatterplot 2, r = Scatterplot 3, r= 15- 8- 8- 14- 6- Scatterplot 4, r = 6- 13- > 4- Scatterplot 5, r= 4- 12- 11- 24 2- 10+ 0+ 0.2 0.4 0.6 0.8 1 0.2 0.4 0.6 0.8 1 0.2 0.4 0.6 0.8 1 Scatterplot 4 Scatterplot 5 0- 8- -1- 6- > -2- 4- -3- 2- :. -4- 0- 0.2 0.4 0.6 0.8 1 0.2 0.4 0.6 0.8 1 X of •. ofarrow_forwardThe vertical axis of a graph is for the dependent variable. True O Falsearrow_forward
arrow_back_ios
SEE MORE QUESTIONS
arrow_forward_ios
Recommended textbooks for you
- A First Course in Probability (10th Edition)ProbabilityISBN:9780134753119Author:Sheldon RossPublisher:PEARSON

A First Course in Probability (10th Edition)
Probability
ISBN:9780134753119
Author:Sheldon Ross
Publisher:PEARSON