
A First Course in Probability (10th Edition)
10th Edition
ISBN: 9780134753119
Author: Sheldon Ross
Publisher: PEARSON
expand_more
expand_more
format_list_bulleted
Related questions
Question
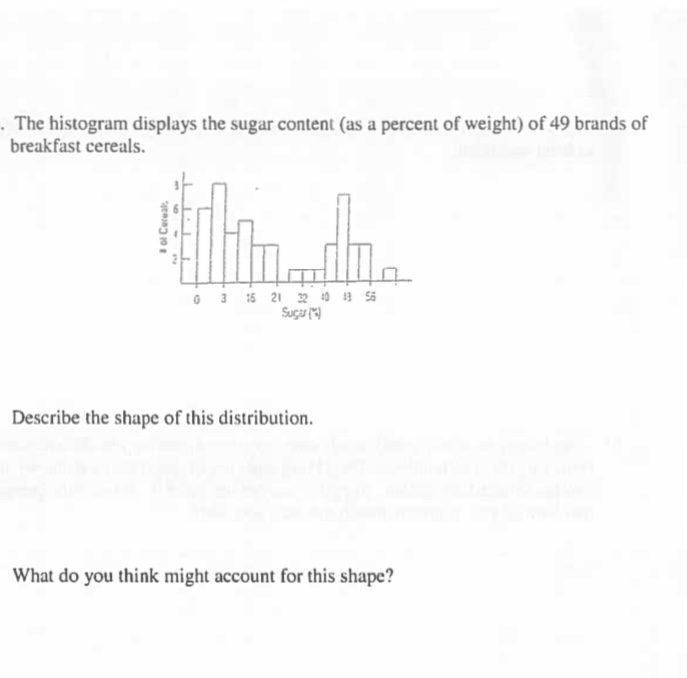

Transcribed Image Text:. The histogram displays the sugar content (as a percent of weight) of 49 brands of
breakfast cereals.
0 3 15 21 32 0 3 55
Sugu (*)
Describe the shape of this distribution.
What do you think might account for this shape?
Expert Solution
This question has been solved!
Explore an expertly crafted, step-by-step solution for a thorough understanding of key concepts.

This is a popular solution

Trending nowThis is a popular solution!

Step by stepSolved in 2 steps

Knowledge Booster

Similar questions
- What is the median?arrow_forwardResearchers wondered whether the size of a person's brain was related to the individual's mental capacity. They selected a sample of 5 females and 5 males and measured their MRI image pixel counts and IQ scores. Females Males MRI IQ MRI IG The data is reported to the right. Complete parts (a) through (d) below 139 858,472 140 955,003 935,494 924,059 1.079.550 1,001.121 Click the icon to view the critical values table. 991,305 138 141 857,782 833,868 790,619 133 135 132 141 135 140 AMRI 1,080,000- AIO 145 AIO 145- AMRI 1,080,000 780,000 130 130 780,000 130 780,000 780,000 130 1,080,000 145 1,080,000 MRI 145 MRI (b) Compute the linear correlation coefficient between MRI count and IQ. Are MRI count and IQ linearly related? Select the correct choice below and, if necessary, fill in the answer box to complete your choice. (Round to three decimal places as needed.) A. Yes, MRI count and IQ are linearly related since the linear correlation coefficient is O B. No. MRI count and IQ are not…arrow_forwardThe following is a distribution representing the weights (in kg) of 25 female junior high school students.arrow_forward
- How many classes are there and what is the class width?arrow_forwardUsing the following stem & leaf plot, find the five number summary for the data. 0 2 3 4 4 5 9 3 4 2 2 79 0 45 6 89 6 0 8 Min = Q1 Med = Q3 = %3D Max =arrow_forwardR A veterinarian recorded how many kittens were born in each litter. This data is summarized in the L histogram below. (Note: The last class actually represents "7 or more kittens," not just 7 kittens.) 14 12 10- 8- 6- 4 1 2 3 4 7 8 # of kittens What is the frequency of litters having at most 3 kittens? ans = Fe Ro 1 FEB 18 P. W MacBook Air 20 000 esc F5 F6 F2 F3 F4 F1 & ! @ 1 2 4 5 Q W R %24 # 3 6 2. Frequencyarrow_forward
- A researcher collected how many grams of fat people on a specific diet consumed at breakfast and at lunch. The data for a sample of 8 people is shown in the table below. xx 11.3 8.2 7.2 3.6 2.3 2.5 2.7 0.4 yy 13.7 10.7 10.2 7.2 6.3 6.5 6.1 4.1 xx = grams of fat in breakfastyy = grams of fat in lunchThis data can be modeled by the equation ˆy=0.84x+4.07.y^=0.84x+4.07.Given this, how many grams of fat in lunch would be expected for a person who consumed 1.2 grams of fat at breakfast? Round to 1 decimal place.Answer =arrow_forwardAp Statsarrow_forwardA researcher records the number of dreams that 50 college freshman students recalled during the night prior to a final exam. Number of Dreams Cumulative Frequency 4 50 3 44 2 30 1 12 0 5 A. Convert this table to a percentile rank distribution. B. What is the number of dreams at the 60th percentile?arrow_forward
arrow_back_ios
arrow_forward_ios
Recommended textbooks for you
- A First Course in Probability (10th Edition)ProbabilityISBN:9780134753119Author:Sheldon RossPublisher:PEARSON

A First Course in Probability (10th Edition)
Probability
ISBN:9780134753119
Author:Sheldon Ross
Publisher:PEARSON